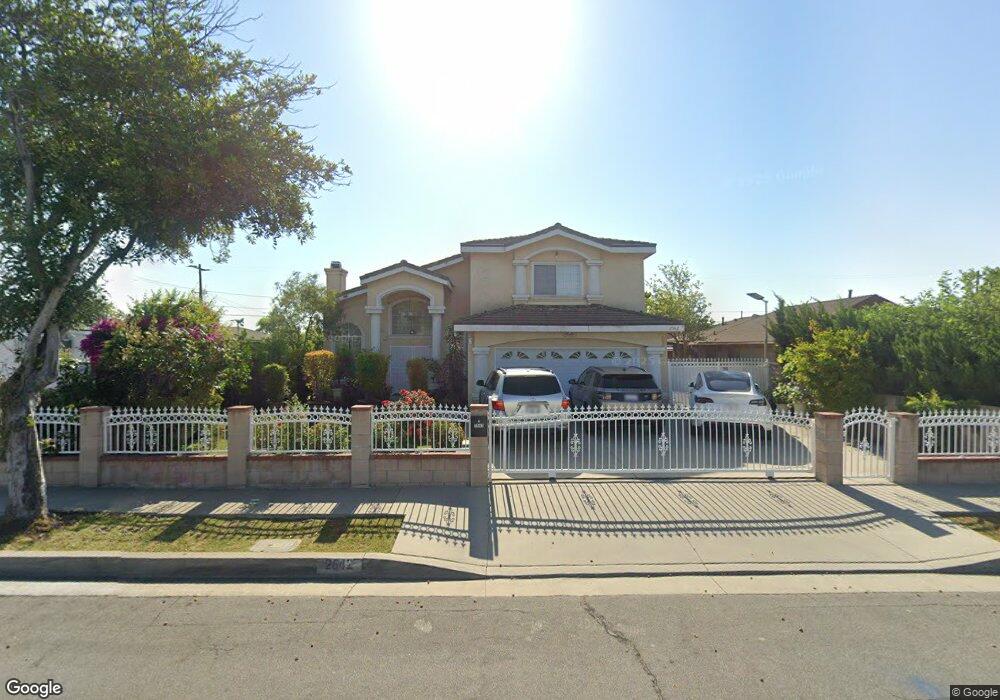
2542 Paljay Ave Rosemead, CA 91770
Estimated Value: $985,000 - $1,218,000
4
Beds
5
Baths
2,496
Sq Ft
$456/Sq Ft
Est. Value
About This Home
This home is located at 2542 Paljay Ave, Rosemead, CA 91770 and is currently estimated at $1,137,495, approximately $455 per square foot. 2542 Paljay Ave is a home located in Los Angeles County with nearby schools including Rice (Eldridge) Elementary School, Temple (Roger W.) Intermediate School, and San Gabriel High School.
Ownership History
Date
Name
Owned For
Owner Type
Purchase Details
Closed on
Dec 22, 2025
Sold by
Nguyen Tina Thanh
Bought by
Tina Thanh Nguyen Revocable Living Trust and Nguyen
Current Estimated Value
Purchase Details
Closed on
Jun 15, 2001
Sold by
Nguyen Joanne Loann
Bought by
Nguyen Joanne Loann and Nguyen Tina Thanh
Home Financials for this Owner
Home Financials are based on the most recent Mortgage that was taken out on this home.
Original Mortgage
$150,000
Interest Rate
7.24%
Mortgage Type
Purchase Money Mortgage
Purchase Details
Closed on
Nov 1, 2000
Sold by
Wong Kam Siu
Bought by
Nguyen Joanne Loann
Home Financials for this Owner
Home Financials are based on the most recent Mortgage that was taken out on this home.
Original Mortgage
$237,000
Interest Rate
7.88%
Purchase Details
Closed on
Feb 18, 1999
Sold by
Gutierrez Ernesto
Bought by
Wong Kam Siu and Wong Kuen Kuen
Create a Home Valuation Report for This Property
The Home Valuation Report is an in-depth analysis detailing your home's value as well as a comparison with similar homes in the area
Home Values in the Area
Average Home Value in this Area
Purchase History
| Date | Buyer | Sale Price | Title Company |
|---|---|---|---|
| Tina Thanh Nguyen Revocable Living Trust | -- | None Listed On Document | |
| Nguyen Joanne Loann | -- | Orange Coast Title | |
| Nguyen Joanne Loann | $395,000 | Gateway Title Company | |
| Wong Kam Siu | $113,000 | Fidelity National Title Co |
Source: Public Records
Mortgage History
| Date | Status | Borrower | Loan Amount |
|---|---|---|---|
| Previous Owner | Nguyen Joanne Loann | $150,000 | |
| Previous Owner | Nguyen Joanne Loann | $237,000 |
Source: Public Records
Tax History
| Year | Tax Paid | Tax Assessment Tax Assessment Total Assessment is a certain percentage of the fair market value that is determined by local assessors to be the total taxable value of land and additions on the property. | Land | Improvement |
|---|---|---|---|---|
| 2025 | $7,573 | $583,513 | $189,526 | $393,987 |
| 2024 | $7,573 | $572,072 | $185,810 | $386,262 |
| 2023 | $7,299 | $560,856 | $182,167 | $378,689 |
| 2022 | $6,959 | $549,860 | $178,596 | $371,264 |
| 2021 | $6,928 | $539,080 | $175,095 | $363,985 |
| 2019 | $6,670 | $523,092 | $169,902 | $353,190 |
| 2018 | $6,552 | $512,836 | $166,571 | $346,265 |
| 2016 | $6,004 | $492,923 | $160,103 | $332,820 |
| 2015 | $5,909 | $485,520 | $157,699 | $327,821 |
| 2014 | $5,835 | $476,010 | $154,610 | $321,400 |
Source: Public Records
Map
Nearby Homes
- 2617 Muscatel Ave
- 2621 Muscatel Ave
- 2725 Walnut Grove Ave
- 0 Leach Canyon Rd Unit DW25215715
- 3135 Bartlett Ave
- 2555 Angelus Ave
- 9040 Garvey Ave Unit 5
- 3239 Ivar Ave
- 1802 Rosebrook Ln
- 3107 N San Gabriel Blvd Unit 7
- 3107 San Gabriel Blvd Unit 6
- 2561 Troy Ave
- 3344 Charlotte Ave
- 8148 Loren Ln
- 2307 Troy Ave
- 3453 Ivar Ave
- 8361 Sierra Bonita Ave
- 9373 9375 Fern St
- 8036 Whitmore St
- 2515 Iconic St
- 2548 Paljay Ave
- 2540 Paljay Ave
- 2530 Paljay Ave
- 8640 Fern Ave
- 2547 La Presa Ave
- 2541 La Presa Ave
- 2553 La Presa Ave
- 2539 La Presa Ave
- 2557 La Presa Ave
- 2526 Paljay Ave
- 2545 Paljay Ave
- 2533 La Presa Ave
- 2539 Paljay Ave
- 2551 Paljay Ave
- 2557 Paljay Ave
- 2529 La Presa Ave
- 2601 La Presa Ave
- 2520 Paljay Ave
- 2527 Paljay Ave
- 2523 La Presa Ave
Your Personal Tour Guide
Ask me questions while you tour the home.