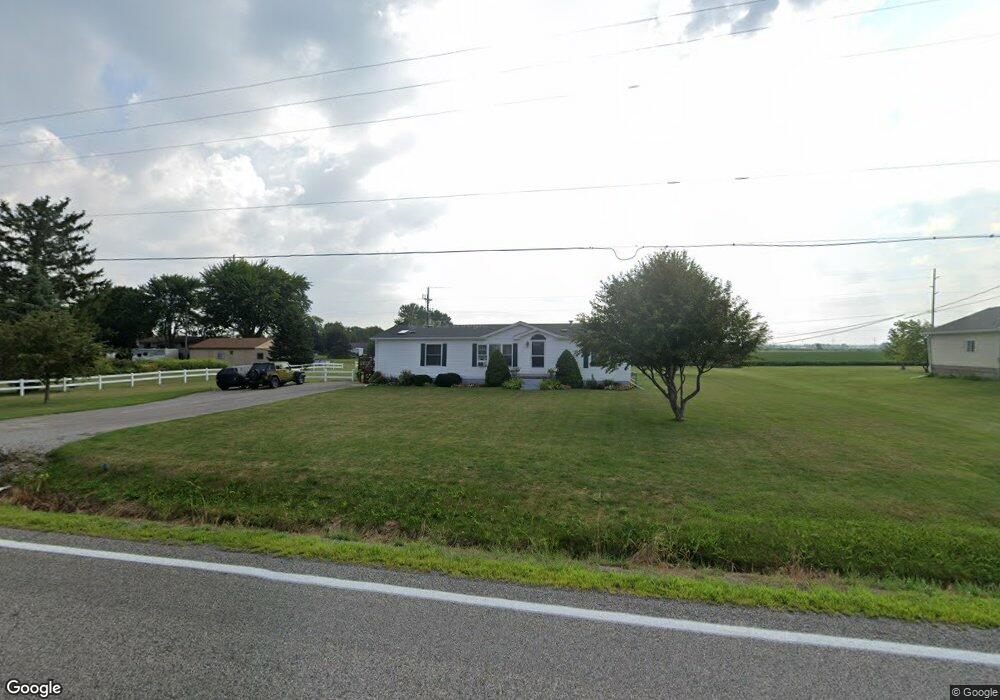
2545 S Mackinaw Rd Kawkawlin, MI 48631
Estimated Value: $127,000 - $291,000
3
Beds
2
Baths
1,568
Sq Ft
$116/Sq Ft
Est. Value
About This Home
This home is located at 2545 S Mackinaw Rd, Kawkawlin, MI 48631 and is currently estimated at $182,000, approximately $116 per square foot. 2545 S Mackinaw Rd is a home located in Bay County with nearby schools including Thrasher Attendance Center, McAlear-Sawden Elementary School, and Quitman Upper Elementary School.
Ownership History
Date
Name
Owned For
Owner Type
Purchase Details
Closed on
Oct 11, 2007
Sold by
Marsac Jennifer L
Bought by
Marsac Troy C and Marsac Jennifer L
Current Estimated Value
Home Financials for this Owner
Home Financials are based on the most recent Mortgage that was taken out on this home.
Original Mortgage
$120,531
Outstanding Balance
$76,386
Interest Rate
6.5%
Mortgage Type
Stand Alone Refi Refinance Of Original Loan
Estimated Equity
$105,614
Purchase Details
Closed on
Jan 11, 2005
Sold by
Baney Raymond J and Baney Marlyn J
Bought by
Marsac Jennifer L
Home Financials for this Owner
Home Financials are based on the most recent Mortgage that was taken out on this home.
Original Mortgage
$98,000
Interest Rate
6.59%
Mortgage Type
Purchase Money Mortgage
Purchase Details
Closed on
Apr 28, 1998
Sold by
Baney Raymond J and Baney Marlyn J
Bought by
Leinberger Jennifer L
Create a Home Valuation Report for This Property
The Home Valuation Report is an in-depth analysis detailing your home's value as well as a comparison with similar homes in the area
Home Values in the Area
Average Home Value in this Area
Purchase History
| Date | Buyer | Sale Price | Title Company |
|---|---|---|---|
| Marsac Troy C | -- | Platinum Title | |
| Marsac Jennifer L | -- | Nta | |
| Leinberger Jennifer L | $8,000 | -- |
Source: Public Records
Mortgage History
| Date | Status | Borrower | Loan Amount |
|---|---|---|---|
| Open | Marsac Troy C | $120,531 | |
| Closed | Marsac Jennifer L | $98,000 |
Source: Public Records
Tax History Compared to Growth
Tax History
| Year | Tax Paid | Tax Assessment Tax Assessment Total Assessment is a certain percentage of the fair market value that is determined by local assessors to be the total taxable value of land and additions on the property. | Land | Improvement |
|---|---|---|---|---|
| 2025 | $2,334 | $111,200 | $0 | $0 |
| 2024 | $1,444 | $98,500 | $0 | $0 |
| 2023 | $1,374 | $82,600 | $0 | $0 |
| 2022 | $2,174 | $73,100 | $0 | $0 |
| 2021 | $2,013 | $69,900 | $69,900 | $0 |
| 2020 | $1,966 | $68,150 | $68,150 | $0 |
| 2019 | $1,896 | $62,350 | $0 | $0 |
| 2018 | $1,845 | $60,000 | $0 | $0 |
| 2017 | $1,811 | $61,100 | $0 | $0 |
| 2016 | $1,818 | $55,500 | $0 | $55,500 |
| 2015 | -- | $53,450 | $0 | $53,450 |
| 2014 | -- | $58,450 | $0 | $58,450 |
Source: Public Records
Map
Nearby Homes
- 1101 E Beaver Rd
- 2430 4 Mile Rd
- 000 Jose Rd
- 661 E Beaver Rd
- 2134 Mara Dr
- 2473 Old Kawkawlin Rd
- 0 E River Rd
- V/L Wheeler Rd
- 109 W Grove St
- 2763 Lauria Rd
- 2406 Beech Dr
- 2449 Maple Dr Unit 151
- 2457 Birch Dr Unit 123
- 439 Wheeler Rd
- 2429 E Birch Dr Unit 116
- 2481 Pajot Rd Unit 58
- 2749 8 Mile Rd
- 2383 8 Mile Rd Unit 26
- 2467 8 Mile Rd Unit 5
- 2431 8 Mile Rd Unit 14
- 2555 S Mackinaw Rd
- 1506 E Beaver Rd
- 1532 E Beaver Rd
- 1540 E Beaver Rd
- 1480 E Beaver Rd
- 1507 E Beaver Rd
- 1550 E Beaver Rd
- 1521 E Beaver Rd
- 1521 E Beaver Rd
- 1468 E Beaver Rd
- 1568 E Beaver Rd
- 1551 E Beaver Rd
- 1580 E Beaver Rd
- 1573 E Beaver Rd
- 1600 E Beaver Rd
- 2623 S Mackinaw Rd
- 1450 E Beaver Rd
- 2443 S Mackinaw Rd
- 2545 Liney Ln
- 1440 E Beaver Rd