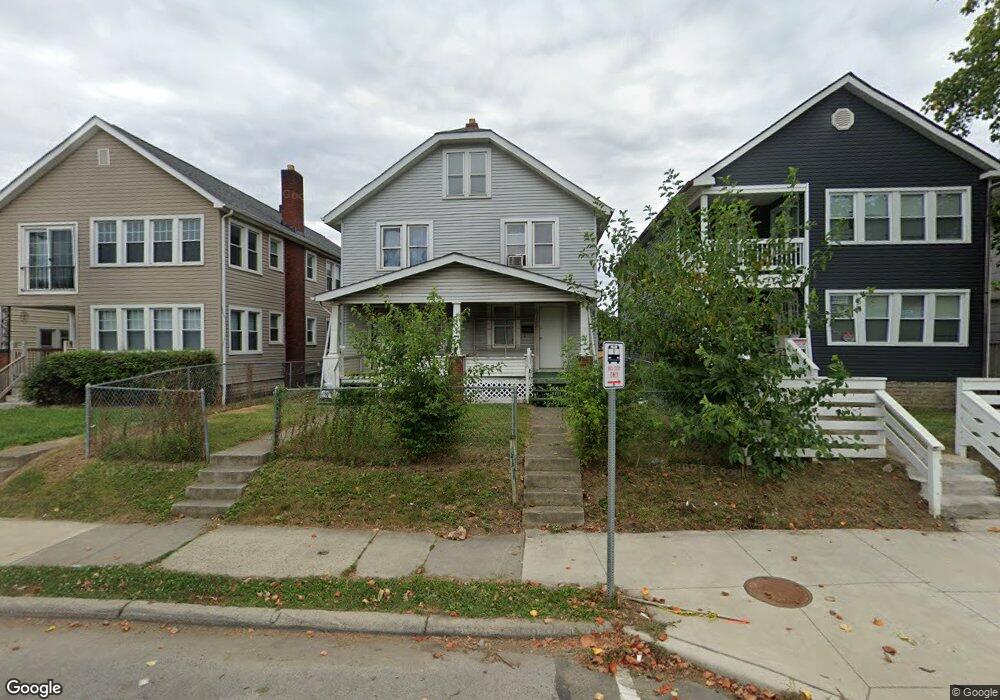
2545 Sullivant Ave Unit 547 Columbus, OH 43204
South Central Hilltop NeighborhoodEstimated Value: $146,438 - $162,000
6
Beds
2
Baths
2,128
Sq Ft
$72/Sq Ft
Est. Value
About This Home
This home is located at 2545 Sullivant Ave Unit 547, Columbus, OH 43204 and is currently estimated at $154,110, approximately $72 per square foot. 2545 Sullivant Ave Unit 547 is a home located in Franklin County with nearby schools including Burroughs Elementary School, Hilltonia Middle School, and Briggs High School.
Ownership History
Date
Name
Owned For
Owner Type
Purchase Details
Closed on
Apr 11, 2025
Sold by
Sem Sokea
Bought by
Amdursky Omri
Current Estimated Value
Home Financials for this Owner
Home Financials are based on the most recent Mortgage that was taken out on this home.
Original Mortgage
$112,500
Outstanding Balance
$111,999
Interest Rate
6.63%
Mortgage Type
Credit Line Revolving
Estimated Equity
$42,111
Purchase Details
Closed on
May 8, 2014
Sold by
Pling Pluch
Bought by
Sem Sokea
Purchase Details
Closed on
Sep 7, 2012
Sold by
Khuon Sokunthea
Bought by
Pling Pluch
Purchase Details
Closed on
Aug 28, 2010
Sold by
Khuon Vantha and Khuon Tevin
Bought by
Khuon Sokunthea
Purchase Details
Closed on
May 22, 2006
Sold by
Chp Lp Iv-A
Bought by
Khuon Vantha and Khuon Tevin
Purchase Details
Closed on
Sep 28, 1990
Bought by
Chp L P Iv-A
Purchase Details
Closed on
Nov 1, 1984
Bought by
Smith Stephen E
Purchase Details
Closed on
Oct 1, 1981
Create a Home Valuation Report for This Property
The Home Valuation Report is an in-depth analysis detailing your home's value as well as a comparison with similar homes in the area
Home Values in the Area
Average Home Value in this Area
Purchase History
| Date | Buyer | Sale Price | Title Company |
|---|---|---|---|
| Amdursky Omri | $150,000 | Ohio Real Title | |
| Sem Sokea | $64,500 | None Available | |
| Pling Pluch | $64,500 | None Available | |
| Khuon Sokunthea | $150,000 | Amerititle | |
| Khuon Vantha | $72,000 | Land & Mo | |
| Chp L P Iv-A | $119,000 | -- | |
| Smith Stephen E | $32,200 | -- | |
| -- | $31,500 | -- |
Source: Public Records
Mortgage History
| Date | Status | Borrower | Loan Amount |
|---|---|---|---|
| Open | Amdursky Omri | $112,500 |
Source: Public Records
Tax History Compared to Growth
Tax History
| Year | Tax Paid | Tax Assessment Tax Assessment Total Assessment is a certain percentage of the fair market value that is determined by local assessors to be the total taxable value of land and additions on the property. | Land | Improvement |
|---|---|---|---|---|
| 2024 | $2,084 | $45,470 | $4,450 | $41,020 |
| 2023 | $2,058 | $45,465 | $4,445 | $41,020 |
| 2022 | $1,248 | $23,490 | $2,910 | $20,580 |
| 2021 | $1,251 | $23,490 | $2,910 | $20,580 |
| 2020 | $1,252 | $23,490 | $2,910 | $20,580 |
| 2019 | $1,217 | $19,570 | $2,420 | $17,150 |
| 2018 | $1,306 | $19,570 | $2,420 | $17,150 |
| 2017 | $1,217 | $19,570 | $2,420 | $17,150 |
| 2016 | $1,534 | $22,580 | $4,380 | $18,200 |
| 2015 | $1,397 | $22,580 | $4,380 | $18,200 |
| 2014 | $1,400 | $22,580 | $4,380 | $18,200 |
| 2013 | $691 | $22,575 | $4,375 | $18,200 |
Source: Public Records
Map
Nearby Homes
- 540 S Richardson Ave
- 471 S Terrace Ave Unit 473
- 554 S Ogden Ave
- 599 S Burgess Ave Unit 601
- 426 S Eureka Ave
- 405 S Burgess Ave
- 651 S Terrace Ave
- 397 S Burgess Ave
- 2397 Sullivant Ave
- 510 S Warren Ave
- 500 S Warren Ave
- 448 S Warren Ave
- 614 S Warren Ave
- 444 S Warren Ave
- 620 S Warren Ave
- 2715 Sullivant Ave
- 595 S Warren Ave
- 349 S Eureka Ave
- 418 S Warren Ave
- 558 S Oakley Ave Unit 60
- 2541-2543 Sullivant Ave
- 2551 Sullivant Ave Unit 553
- 2551 Sullivant Ave Unit 3
- 2541 Sullivant Ave Unit 543
- 2555-2557 Sullivant Ave
- 2535 Sullivant Ave Unit 537
- 2561 Sullivant Ave
- 2527-2529 Sullivant Ave
- 2527 Sullivant Ave Unit 529
- 2544 Sullivant Ave
- 538 S Richardson Ave
- 534 S Richardson Ave
- 527 S Terrace Ave
- 2523 Sullivant Ave
- 2560 Sullivant Ave
- 2550 Sullivant Ave
- 531 S Terrace Ave
- 2542 Sullivant Ave
- 546 S Richardson Ave
- 2560-2562 Sullivant Ave