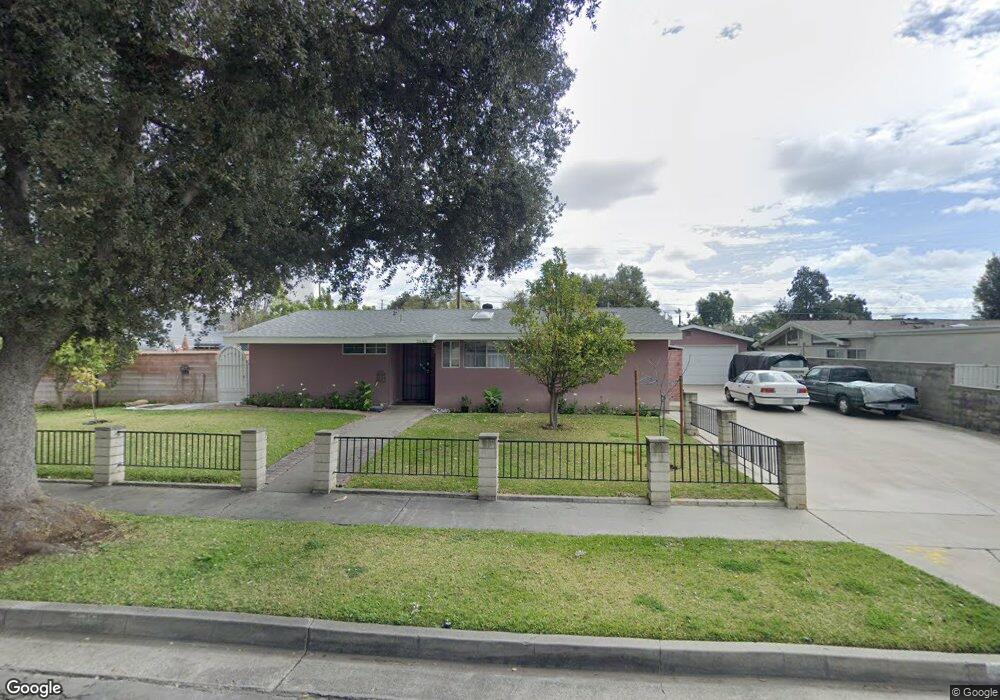
2548 E Santa fe Ave Fullerton, CA 92831
Estimated Value: $991,000 - $1,141,000
4
Beds
2
Baths
1,733
Sq Ft
$610/Sq Ft
Est. Value
About This Home
This home is located at 2548 E Santa fe Ave, Fullerton, CA 92831 and is currently estimated at $1,057,612, approximately $610 per square foot. 2548 E Santa fe Ave is a home located in Orange County with nearby schools including Commonwealth Elementary School, Ladera Vista Junior High School, and Troy High School.
Ownership History
Date
Name
Owned For
Owner Type
Purchase Details
Closed on
Sep 21, 2023
Sold by
Vieyra Rafael Alvarez and Vieyra Margarita
Bought by
Rafael Alvarez Vieyra And Margartia Moreno Li and Vieyra
Current Estimated Value
Purchase Details
Closed on
Jun 14, 2001
Sold by
Wu Tina T
Bought by
Vieira Rafael A and Moreno Margarita
Home Financials for this Owner
Home Financials are based on the most recent Mortgage that was taken out on this home.
Original Mortgage
$229,600
Interest Rate
7.15%
Purchase Details
Closed on
Feb 1, 2001
Sold by
Wu Tina T and Cho Connie
Bought by
Wu Tina T
Purchase Details
Closed on
Jan 27, 2000
Sold by
Wu Tina T
Bought by
Wu Tina T and Cho Connie
Purchase Details
Closed on
Oct 20, 1998
Sold by
Cho Ching Wen Wu
Bought by
Wu Tina T
Purchase Details
Closed on
Aug 29, 1997
Sold by
Wen Wu Ching and Wen Hsiu K
Bought by
Cho Ching Wen Wu
Create a Home Valuation Report for This Property
The Home Valuation Report is an in-depth analysis detailing your home's value as well as a comparison with similar homes in the area
Purchase History
| Date | Buyer | Sale Price | Title Company |
|---|---|---|---|
| Rafael Alvarez Vieyra And Margartia Moreno Li | -- | None Listed On Document | |
| Vieira Rafael A | $287,000 | Southland Title Corporation | |
| Wu Tina T | -- | Southland Title Corporation | |
| Wu Tina T | -- | -- | |
| Wu Tina T | -- | Fidelity National Title Ins | |
| Cho Ching Wen Wu | -- | -- |
Source: Public Records
Mortgage History
| Date | Status | Borrower | Loan Amount |
|---|---|---|---|
| Previous Owner | Vieira Rafael A | $229,600 | |
| Closed | Vieira Rafael A | $28,700 |
Source: Public Records
Tax History
| Year | Tax Paid | Tax Assessment Tax Assessment Total Assessment is a certain percentage of the fair market value that is determined by local assessors to be the total taxable value of land and additions on the property. | Land | Improvement |
|---|---|---|---|---|
| 2025 | $4,751 | $423,978 | $335,208 | $88,770 |
| 2024 | $4,751 | $415,665 | $328,635 | $87,030 |
| 2023 | $4,634 | $407,515 | $322,191 | $85,324 |
| 2022 | $4,600 | $399,525 | $315,874 | $83,651 |
| 2021 | $4,519 | $391,692 | $309,681 | $82,011 |
| 2020 | $4,494 | $387,676 | $306,505 | $81,171 |
| 2019 | $4,378 | $380,075 | $300,495 | $79,580 |
| 2018 | $4,311 | $372,623 | $294,603 | $78,020 |
| 2017 | $4,239 | $365,317 | $288,826 | $76,491 |
| 2016 | $4,150 | $358,154 | $283,162 | $74,992 |
| 2015 | $4,035 | $352,775 | $278,909 | $73,866 |
| 2014 | $3,918 | $345,865 | $273,445 | $72,420 |
Source: Public Records
Map
Nearby Homes
- 2617 Pearson Ave
- 2518 Pearson Ave
- 2500 Santa Ysabel Ave
- 2470 Santa Clara Ave
- 2428 Santa Clara Ave
- 412 W Santa fe Ave
- 315 Baker St
- 201 S Melrose St
- 449 Melody Ln
- 503 Wilson Cir
- 2220 E Chapman Ave Unit 51
- 219 Ladera Vista Dr
- 161 E Orangethorpe Ave Unit 102
- 161 E Orangethorpe Ave Unit 81
- 161 E Orangethorpe Ave Unit 163
- 712 Oriole Ave
- 650 Kansas Ave
- 210 Silverlake Dr
- 1736 E Commonwealth Ave Unit 102
- 1768 E Commonwealth Ave Unit 104
- 2544 E Santa fe Ave
- 2541 Wallace Ave
- 2540 E Santa fe Ave
- 2600 E Santa fe Ave
- 2547 E Santa fe Ave
- 2537 Wallace Ave
- 2543 E Santa fe Ave
- 2553 E Santa fe Ave
- 2601 Wallace Ave
- 2536 E Santa fe Ave
- 2604 E Santa fe Ave
- 2539 E Santa fe Ave
- 2533 Wallace Ave
- 2601 E Santa fe Ave
- 2532 E Santa fe Ave
- 2605 E Santa fe Ave
- 2535 E Santa fe Ave
- 2605 Wallace Ave
- 2606 E Santa fe Ave
- 2529 Wallace Ave
Your Personal Tour Guide
Ask me questions while you tour the home.