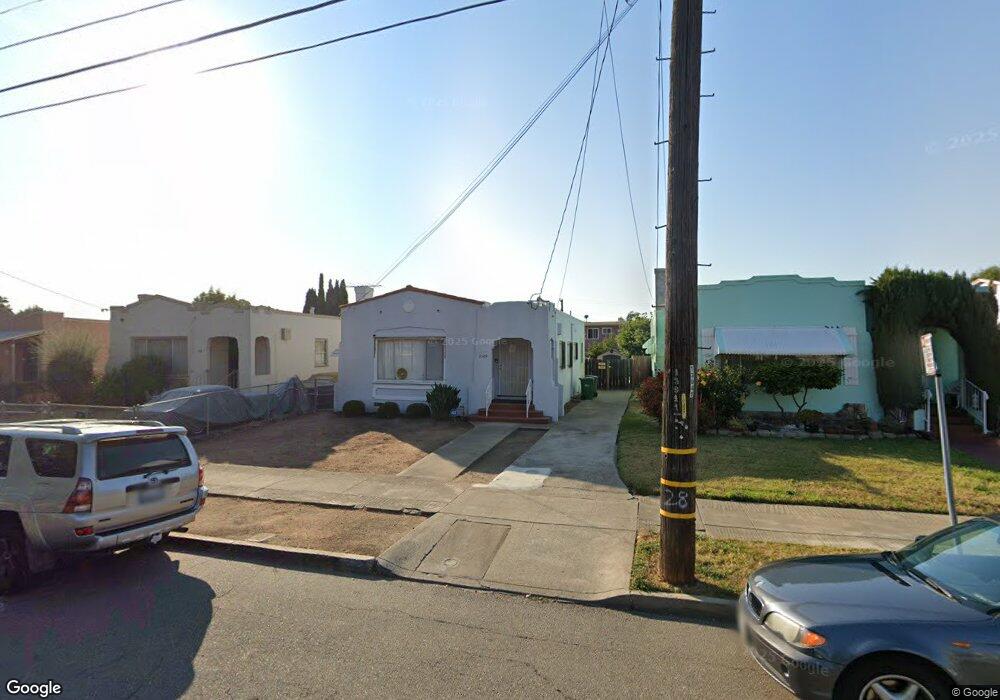
2549 Ritchie St Oakland, CA 94605
Eastmont NeighborhoodEstimated Value: $462,761 - $628,000
3
Beds
1
Bath
1,176
Sq Ft
$452/Sq Ft
Est. Value
About This Home
This home is located at 2549 Ritchie St, Oakland, CA 94605 and is currently estimated at $531,190, approximately $451 per square foot. 2549 Ritchie St is a home located in Alameda County with nearby schools including East Oakland Pride Elementary School, Frick United Academy of Language, and Coliseum College Prep Academy.
Ownership History
Date
Name
Owned For
Owner Type
Purchase Details
Closed on
Apr 19, 2004
Sold by
Jackson Charles B and Jackson Karla A
Bought by
Jackson Charles B and Jackson Karla A
Current Estimated Value
Home Financials for this Owner
Home Financials are based on the most recent Mortgage that was taken out on this home.
Original Mortgage
$260,000
Interest Rate
5.75%
Mortgage Type
New Conventional
Create a Home Valuation Report for This Property
The Home Valuation Report is an in-depth analysis detailing your home's value as well as a comparison with similar homes in the area
Home Values in the Area
Average Home Value in this Area
Purchase History
| Date | Buyer | Sale Price | Title Company |
|---|---|---|---|
| Jackson Charles B | -- | Fidelity National Title Co |
Source: Public Records
Mortgage History
| Date | Status | Borrower | Loan Amount |
|---|---|---|---|
| Closed | Jackson Charles B | $260,000 |
Source: Public Records
Tax History
| Year | Tax Paid | Tax Assessment Tax Assessment Total Assessment is a certain percentage of the fair market value that is determined by local assessors to be the total taxable value of land and additions on the property. | Land | Improvement |
|---|---|---|---|---|
| 2025 | $5,543 | $153,121 | $34,452 | $118,669 |
| 2024 | $5,543 | $150,120 | $33,777 | $116,343 |
| 2023 | $5,620 | $147,176 | $33,114 | $114,062 |
| 2022 | $5,457 | $144,290 | $32,465 | $111,825 |
| 2021 | $5,163 | $141,462 | $31,829 | $109,633 |
| 2020 | $5,124 | $140,011 | $31,502 | $108,509 |
| 2019 | $3,112 | $137,267 | $30,885 | $106,382 |
| 2018 | $3,051 | $134,575 | $30,279 | $104,296 |
| 2017 | $2,904 | $131,936 | $29,685 | $102,251 |
| 2016 | $2,727 | $129,351 | $29,104 | $100,247 |
| 2015 | $2,710 | $127,407 | $28,666 | $98,741 |
| 2014 | $2,641 | $124,913 | $28,105 | $96,808 |
Source: Public Records
Map
Nearby Homes
- 7856 Garfield Ave
- 7940 Bancroft Ave
- 0 Bancroft Ave
- 2714 79th Ave
- 7700 Garfield Ave
- 2521 80th Ave
- 2522 75th Ave
- 2612 75th Ave
- 1974 82nd Ave
- 1927 82nd Ave
- 2625 75th Ave
- 2740 76th Ave
- 8016 Macarthur Blvd
- 2314 84th Ave
- 7818 Arthur St
- 2751 75th Ave
- 2527 84th Ave
- 8301 Macarthur Blvd
- 8117 Ney Ave
- 8311 Macarthur Blvd
- 2601 Ritchie St
- 2543 Ritchie St
- 2537 Ritchie St
- 2607 Ritchie St
- 2600 79th Ave
- 2615 Ritchie St
- 2546 79th Ave
- 2606 79th Ave
- 2612 79th Ave
- 2538 79th Ave
- 2525 Ritchie St
- 2618 79th Ave
- 2544 Ritchie St
- 2600 Ritchie St
- 2538 Ritchie St
- 2606 Ritchie St
- 2530 79th Ave
- 2627 Ritchie St
- 2624 79th Ave
- 2532 Ritchie St
Your Personal Tour Guide
Ask me questions while you tour the home.