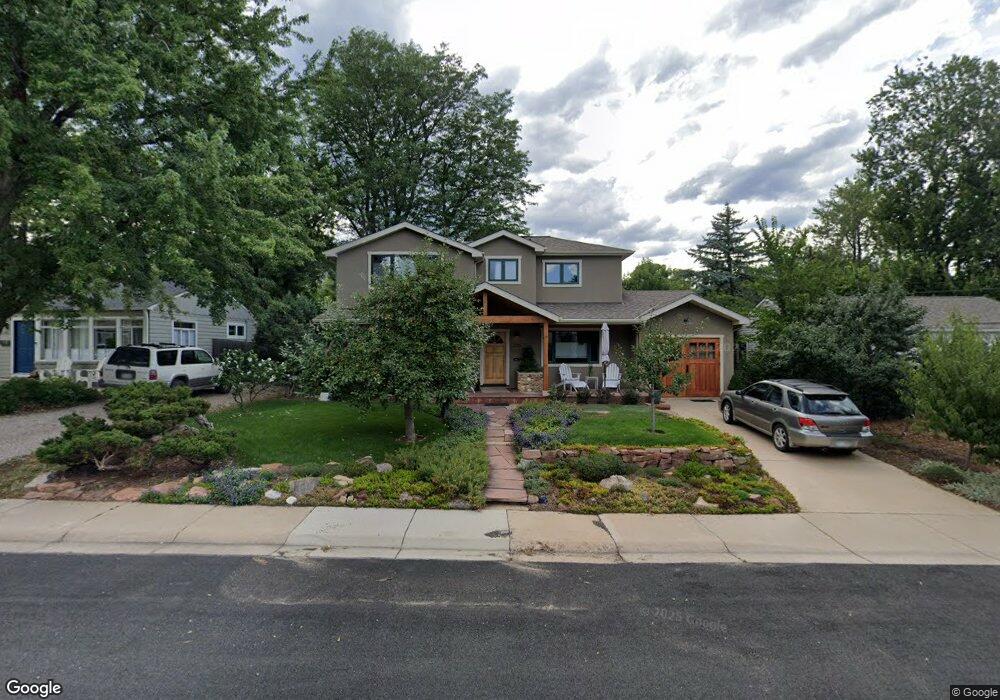
255 28th St Boulder, CO 80305
South Boulder NeighborhoodEstimated Value: $959,000 - $1,129,000
3
Beds
2
Baths
1,606
Sq Ft
$652/Sq Ft
Est. Value
About This Home
This home is located at 255 28th St, Boulder, CO 80305 and is currently estimated at $1,046,645, approximately $651 per square foot. 255 28th St is a home located in Boulder County with nearby schools including Creekside Elementary School, Manhattan Middle School of the Arts & Academics, and Fairview High School.
Ownership History
Date
Name
Owned For
Owner Type
Purchase Details
Closed on
Oct 25, 2000
Sold by
Laniewicz James M and Laniewicz Cheryl F
Bought by
Cvencek Steven R and Cvencek Kari Anne
Current Estimated Value
Home Financials for this Owner
Home Financials are based on the most recent Mortgage that was taken out on this home.
Original Mortgage
$198,400
Outstanding Balance
$73,159
Interest Rate
7.89%
Estimated Equity
$973,486
Purchase Details
Closed on
May 1, 1995
Sold by
Naumer Catherine L
Bought by
Smith Connie A
Home Financials for this Owner
Home Financials are based on the most recent Mortgage that was taken out on this home.
Original Mortgage
$121,550
Interest Rate
8.33%
Purchase Details
Closed on
Mar 1, 1993
Bought by
Smith Connie A and Kimman Harmon J
Purchase Details
Closed on
Jan 26, 1993
Bought by
Smith Connie A and Kimman Harmon J
Purchase Details
Closed on
Mar 5, 1990
Bought by
Smith Connie A and Kimman Harmon J
Create a Home Valuation Report for This Property
The Home Valuation Report is an in-depth analysis detailing your home's value as well as a comparison with similar homes in the area
Home Values in the Area
Average Home Value in this Area
Purchase History
| Date | Buyer | Sale Price | Title Company |
|---|---|---|---|
| Cvencek Steven R | $248,000 | -- | |
| Smith Connie A | $143,000 | -- | |
| Smith Connie A | $109,500 | -- | |
| Smith Connie A | -- | -- | |
| Smith Connie A | -- | -- |
Source: Public Records
Mortgage History
| Date | Status | Borrower | Loan Amount |
|---|---|---|---|
| Open | Cvencek Steven R | $198,400 | |
| Previous Owner | Smith Connie A | $121,550 |
Source: Public Records
Tax History
| Year | Tax Paid | Tax Assessment Tax Assessment Total Assessment is a certain percentage of the fair market value that is determined by local assessors to be the total taxable value of land and additions on the property. | Land | Improvement |
|---|---|---|---|---|
| 2025 | $6,678 | $69,025 | $27,094 | $41,931 |
| 2024 | $6,678 | $69,025 | $27,094 | $41,931 |
| 2023 | $6,563 | $75,991 | $31,872 | $47,805 |
| 2022 | $5,749 | $61,903 | $24,137 | $37,766 |
| 2021 | $5,482 | $63,685 | $24,832 | $38,853 |
| 2020 | $4,975 | $57,158 | $23,953 | $33,205 |
| 2019 | $4,899 | $57,158 | $23,953 | $33,205 |
| 2018 | $4,351 | $50,184 | $22,032 | $28,152 |
| 2017 | $4,215 | $57,416 | $24,358 | $33,058 |
| 2016 | $4,113 | $47,513 | $19,024 | $28,489 |
| 2015 | $3,895 | $39,959 | $20,457 | $19,502 |
| 2014 | $3,360 | $39,959 | $20,457 | $19,502 |
Source: Public Records
Map
Nearby Homes
- 2221 Columbine Ave
- 245 Fair Place
- 805 29th St Unit 253
- 805 29th St Unit 157
- 805 29th St Unit 402
- 805 29th St Unit 404
- 2141 Baseline Rd Unit 18
- 2032 Mariposa Ave
- 370 20th St
- 2030 Columbine Ave
- 2800 Aurora Ave Unit 119
- 2850 Aurora Ave Unit 107
- 3000 Dartmouth Ave
- 780 33rd St
- 2585 Kohler Dr
- 626 17th St
- 2955 Stanford Ave
- 2850 E College Ave Unit 301
- 1550 Bluebell Ave
- 3805 Martin Dr
Your Personal Tour Guide
Ask me questions while you tour the home.