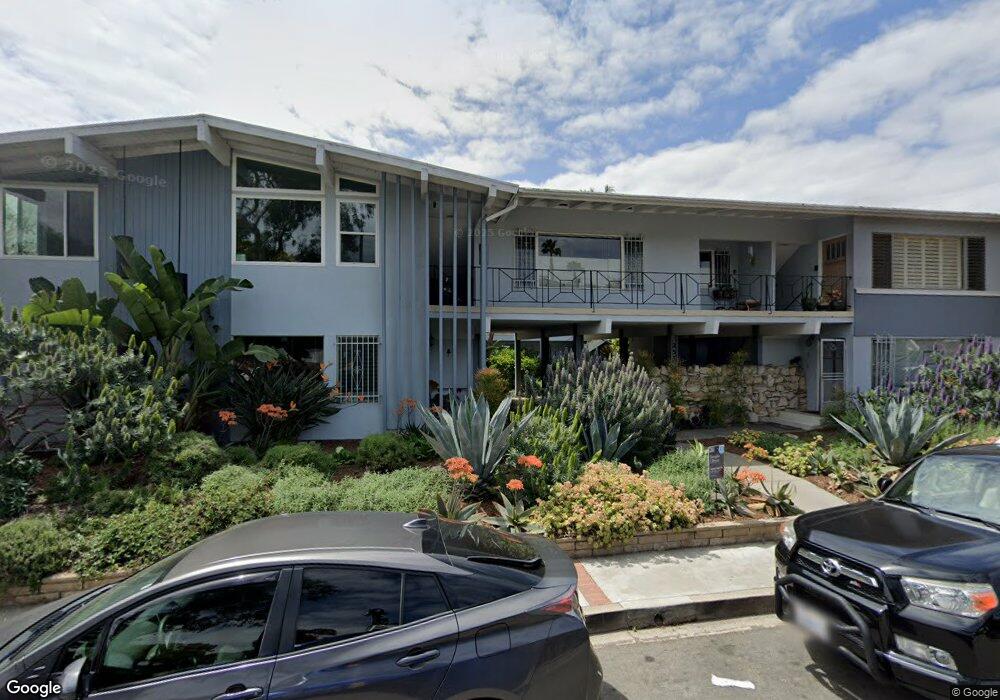
255 Cypress Dr Laguna Beach, CA 92651
Estimated Value: $934,000 - $1,731,982
1
Bed
1
Bath
741
Sq Ft
$1,599/Sq Ft
Est. Value
About This Home
This home is located at 255 Cypress Dr, Laguna Beach, CA 92651 and is currently estimated at $1,184,496, approximately $1,598 per square foot. 255 Cypress Dr is a home located in Orange County with nearby schools including El Morro Elementary School, Thurston Middle School, and Laguna Beach High School.
Ownership History
Date
Name
Owned For
Owner Type
Purchase Details
Closed on
Apr 13, 2015
Sold by
Kohler John and Kohler Yan Yun Yang
Bought by
Dawe Michael George and Dawe Mary Byrne
Current Estimated Value
Purchase Details
Closed on
Mar 24, 2014
Sold by
Kohler John A and Kohler Yan Yun Yang
Bought by
Kohler John and Kohler Eva
Purchase Details
Closed on
Jun 13, 2003
Sold by
Kohler John A
Bought by
Kohler John A and Kohler Yan Yun Yang
Purchase Details
Closed on
Dec 13, 2002
Sold by
Kohler Clara
Bought by
Kohler John A
Purchase Details
Closed on
Oct 16, 1995
Sold by
Reed Ruth E
Bought by
Kohler John A and Kohler Clara G
Create a Home Valuation Report for This Property
The Home Valuation Report is an in-depth analysis detailing your home's value as well as a comparison with similar homes in the area
Home Values in the Area
Average Home Value in this Area
Purchase History
| Date | Buyer | Sale Price | Title Company |
|---|---|---|---|
| Dawe Michael George | $450,000 | Lawyers Title | |
| Kohler John | -- | None Available | |
| Kohler John A | -- | North American Title Co | |
| Kohler John A | -- | -- | |
| Kohler John A | $110,000 | Commonwealth Land Title Co |
Source: Public Records
Tax History Compared to Growth
Tax History
| Year | Tax Paid | Tax Assessment Tax Assessment Total Assessment is a certain percentage of the fair market value that is determined by local assessors to be the total taxable value of land and additions on the property. | Land | Improvement |
|---|---|---|---|---|
| 2025 | $6,352 | $540,827 | $486,523 | $54,304 |
| 2024 | $6,352 | $530,223 | $476,983 | $53,240 |
| 2023 | $6,175 | $519,827 | $467,630 | $52,197 |
| 2022 | $6,026 | $509,635 | $458,461 | $51,174 |
| 2021 | $5,879 | $499,643 | $449,472 | $50,171 |
| 2020 | $5,781 | $494,520 | $444,863 | $49,657 |
| 2019 | $5,659 | $484,824 | $436,140 | $48,684 |
| 2018 | $5,536 | $475,318 | $427,588 | $47,730 |
| 2017 | $5,410 | $465,999 | $419,204 | $46,795 |
| 2016 | $5,291 | $456,862 | $410,984 | $45,878 |
| 2015 | $2,162 | $152,039 | $110,580 | $41,459 |
| 2014 | $2,105 | $149,061 | $108,414 | $40,647 |
Source: Public Records
Map
Nearby Homes
- 234 Cliff Dr Unit 4
- 387 Cypress Dr Unit 7
- 432 N Coast Hwy
- 422 Cypress Dr
- 428 Cypress Dr Unit 428
- 438 Cypress Dr Unit 3
- 205 High Dr
- 135 High Dr
- 134 High Dr
- 0 Laguna Ave
- 520 Cliff Dr Unit 304
- 385 Mermaid St
- 310 Hawthorne Rd
- 336 Lookout Dr
- 482 High Dr
- 535 High Dr
- 625 High Dr
- 522 High Dr
- 421 Loma Terrace
- 530 High Dr
- 255 Cypress Dr Unit 8
- 255 Cypress Dr
- 255 Cypress Dr Unit 5
- 255 Cypress Dr Unit 9
- 255 Cypress Dr Unit 2
- 255 Cypress Dr Unit 11
- 255 Cypress Dr
- 255 Cypress Dr Unit 6
- 255 Cypress Dr Unit 16
- 255 Cypress Dr
- 255 Cypress Dr Unit 14
- 255 Cypress Dr
- 255 Cypress Dr
- 255 Cypress Dr
- 255 Cypress Dr
- 255 Cypress Dr Unit 10
- 255 Cypress Dr
- 255 Cypress Dr
- 255 Cypress Dr Unit 3
- 249 Cypress Dr