255 Eugenia Dr Ventura, CA 93003
Midtown NeighborhoodEstimated Value: $1,164,000 - $1,366,000
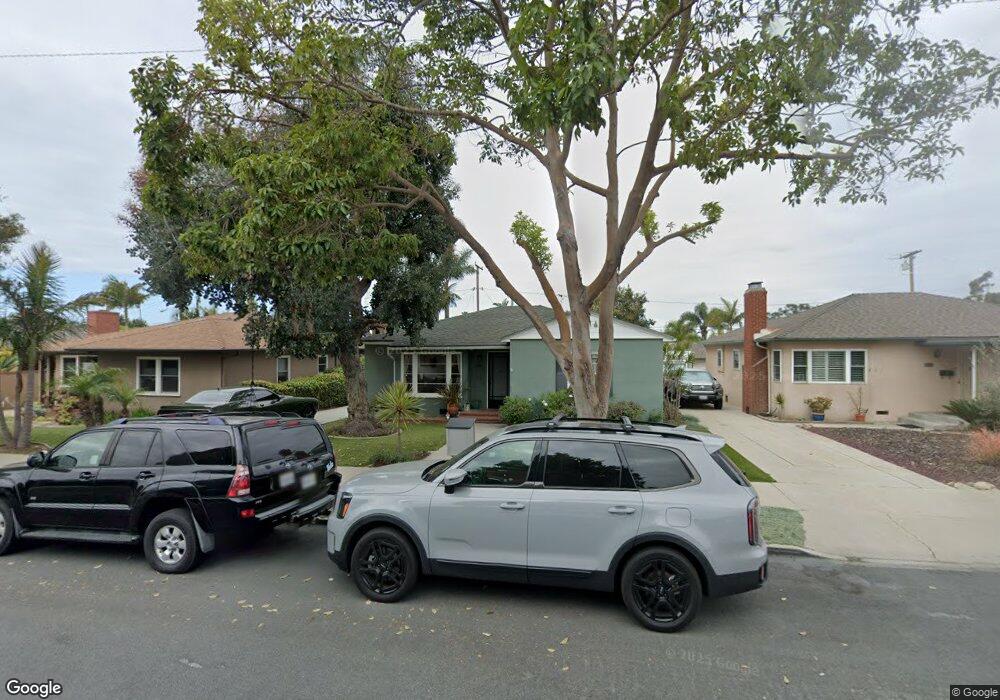
About This Home
This home is located at 255 Eugenia Dr, Ventura, CA 93003 and is currently estimated at $1,228,578, approximately $691 per square foot. 255 Eugenia Dr is a home located in Ventura County with nearby schools including Loma Vista Elementary School, Cabrillo Middle School, and Ventura High School.
Ownership History
We collect this data history from publicly available records. To have your information removed, we recommend requesting removal directly through your county’s website.
Purchase Details
Home Financials for this Owner
Home Financials are based on the most recent Mortgage that was taken out on this home.Purchase Details
Purchase Details
Home Financials for this Owner
Home Financials are based on the most recent Mortgage that was taken out on this home.Purchase Details
Home Financials for this Owner
Home Financials are based on the most recent Mortgage that was taken out on this home.Purchase Details
Purchase Details
Home Financials for this Owner
Home Financials are based on the most recent Mortgage that was taken out on this home.Purchase Details
Purchase Details
Home Financials for this Owner
Home Financials are based on the most recent Mortgage that was taken out on this home.Purchase Details
Home Financials for this Owner
Home Financials are based on the most recent Mortgage that was taken out on this home.Purchase Details
Home Financials for this Owner
Home Financials are based on the most recent Mortgage that was taken out on this home.Purchase Details
Purchase Details
Home Financials for this Owner
Home Financials are based on the most recent Mortgage that was taken out on this home.Purchase Details
Home Financials for this Owner
Home Financials are based on the most recent Mortgage that was taken out on this home.Purchase Details
Purchase Details
Home Financials for this Owner
Home Financials are based on the most recent Mortgage that was taken out on this home.Home Values in the Area
Average Home Value in this Area
Purchase History
We collect this data history from publicly available records. To have your information removed, we recommend requesting removal directly through your county’s website.
| Date | Buyer | Sale Price | Title Company |
|---|---|---|---|
| -- | Chicago Title | ||
| -- | None Availablei | ||
| $730,000 | Chicago Title Company | ||
| -- | Equity Title | ||
| -- | None Available | ||
| -- | Equity Title Company | ||
| -- | -- | ||
| -- | Alliance Title Company | ||
| -- | -- | ||
| -- | -- | ||
| $315,000 | American Title Co | ||
| -- | -- | ||
| -- | Fidelity National Title | ||
| -- | -- | ||
| $270,000 | First American Title Ins Co |
Mortgage History
We collect this data history from publicly available records. To have your information removed, we recommend requesting removal directly through your county’s website.
| Date | Status | Borrower | Loan Amount |
|---|---|---|---|
| Open | $482,000 | ||
| Previous Owner | $500,000 | ||
| Previous Owner | $585,000 | ||
| Previous Owner | $506,000 | ||
| Previous Owner | $250,000 | ||
| Previous Owner | $94,000 | ||
| Previous Owner | $95,000 |
Tax History
We collect this data history from publicly available records. To have your information removed, we recommend requesting removal directly through your county’s website.
| Year | Tax Paid | Tax Assessment Tax Assessment Total Assessment is a certain percentage of the fair market value that is determined by local assessors to be the total taxable value of land and additions on the property. | Land | Improvement |
|---|---|---|---|---|
| 2025 | $9,079 | $847,222 | $550,696 | $296,526 |
| 2024 | $9,079 | $830,610 | $539,898 | $290,712 |
| 2023 | $8,968 | $814,324 | $529,312 | $285,012 |
| 2022 | $8,347 | $798,357 | $518,933 | $279,424 |
| 2021 | $8,185 | $782,703 | $508,757 | $273,946 |
| 2020 | $8,106 | $774,680 | $503,542 | $271,138 |
| 2019 | $7,954 | $759,491 | $493,669 | $265,822 |
| 2018 | $7,820 | $744,600 | $483,990 | $260,610 |
| 2017 | $7,712 | $735,643 | $520,611 | $215,032 |
| 2016 | $10,446 | $721,219 | $510,403 | $210,816 |
| 2015 | $7,244 | $688,000 | $488,000 | $200,000 |
| 2014 | $6,498 | $615,000 | $436,000 | $179,000 |
Map
- 2484 Fernwood Dr
- 2456 Sherwood Dr
- 505 Briarwood Terrace
- 2381 Hyland Ave
- 80 S Seaward Ave
- 2346 Sunset Dr
- 215 Coronado St
- 330 S Seaward Ave
- 44 Coronado St Unit 202
- 2619 E Ocean Ave
- 293 Jordan Ave
- 340 Jones St
- 400 Arcade Dr
- 3254 Breaker Dr
- 457 Coronado St
- 1918 Hillcrest Dr
- 1918 Hillcrest Dr Unit 1
- 3302 San Luis St
- 1808 Poli St
- 171 Lang St
- 246 Eugenia Dr
- 254 Eugenia Dr
- 2603 Mckinley Dr
- 264 Eugenia Dr
- 287 Virginia Dr
- 2635 Mckinley Dr
- 295 Virginia Dr
- 270 Eugenia Dr
- 305 Virginia Dr
- 245 Eugenia Dr
- 2591 Mckinley Dr
- 216 Eugenia Dr
- 315 Virginia Dr
- 278 Eugenia Dr
- 2620 Mckinley Dr
- 265 Eugenia Dr
- 271 Eugenia Dr
- 221 Eugenia Dr
- 243 Virginia Dr
- 286 Eugenia Dr
Ask me questions while you tour the home.