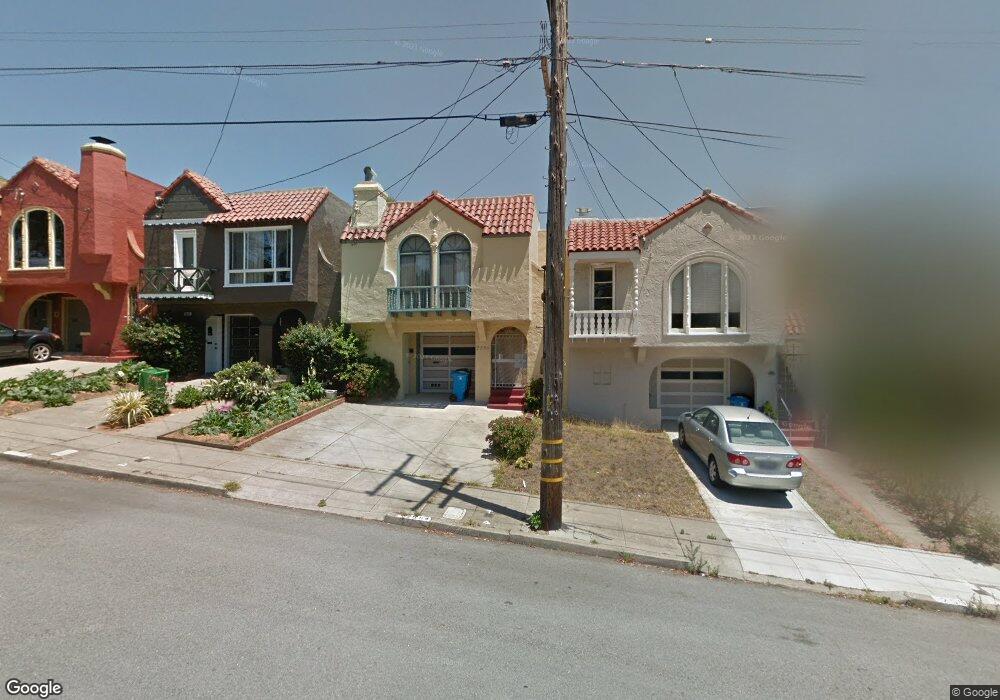
2550 36th Ave San Francisco, CA 94116
Parkside NeighborhoodEstimated Value: $1,563,000 - $1,962,727
3
Beds
2
Baths
2,212
Sq Ft
$812/Sq Ft
Est. Value
About This Home
This home is located at 2550 36th Ave, San Francisco, CA 94116 and is currently estimated at $1,795,182, approximately $811 per square foot. 2550 36th Ave is a home located in San Francisco County with nearby schools including Dianne Feinstein Elementary, Aptos Middle School, and St. Gabriel School.
Ownership History
Date
Name
Owned For
Owner Type
Purchase Details
Closed on
Aug 15, 2018
Sold by
Zhang Peter and Zhang Christine
Bought by
Chan Jason and Chan Judy
Current Estimated Value
Home Financials for this Owner
Home Financials are based on the most recent Mortgage that was taken out on this home.
Original Mortgage
$840,000
Outstanding Balance
$729,506
Interest Rate
4.5%
Mortgage Type
New Conventional
Estimated Equity
$1,065,676
Purchase Details
Closed on
Mar 6, 2008
Sold by
Dolch Debra J and The Phyllis Lucassen Living Tr
Bought by
Zheng Peter and Zheng Christine
Home Financials for this Owner
Home Financials are based on the most recent Mortgage that was taken out on this home.
Original Mortgage
$684,000
Interest Rate
6.75%
Mortgage Type
Purchase Money Mortgage
Purchase Details
Closed on
Aug 1, 1996
Sold by
Lucassen Phyllis and Lucassen Phyllis Marie
Bought by
Lucassen Phyllis and The Phyllis Lucassen Living Tr
Create a Home Valuation Report for This Property
The Home Valuation Report is an in-depth analysis detailing your home's value as well as a comparison with similar homes in the area
Home Values in the Area
Average Home Value in this Area
Purchase History
| Date | Buyer | Sale Price | Title Company |
|---|---|---|---|
| Chan Jason | $1,200,000 | Fidelity National Title Co | |
| Zheng Peter | $855,000 | Old Republic Title Company | |
| Lucassen Phyllis | -- | -- |
Source: Public Records
Mortgage History
| Date | Status | Borrower | Loan Amount |
|---|---|---|---|
| Open | Chan Jason | $840,000 | |
| Previous Owner | Zheng Peter | $684,000 |
Source: Public Records
Tax History Compared to Growth
Tax History
| Year | Tax Paid | Tax Assessment Tax Assessment Total Assessment is a certain percentage of the fair market value that is determined by local assessors to be the total taxable value of land and additions on the property. | Land | Improvement |
|---|---|---|---|---|
| 2025 | $18,725 | $1,561,722 | $1,093,207 | $468,515 |
| 2024 | $18,725 | $1,531,101 | $1,071,772 | $459,329 |
| 2023 | $18,444 | $1,501,080 | $1,050,757 | $450,323 |
| 2022 | $18,094 | $1,471,648 | $1,030,154 | $441,494 |
| 2021 | $17,775 | $1,442,793 | $1,009,955 | $432,838 |
| 2020 | $17,904 | $1,428,000 | $999,600 | $428,400 |
| 2019 | $17,242 | $1,400,000 | $980,000 | $420,000 |
| 2018 | $13,374 | $1,089,886 | $690,911 | $398,975 |
| 2017 | $12,918 | $1,068,517 | $677,364 | $391,153 |
| 2016 | $12,705 | $1,047,567 | $664,083 | $383,484 |
| 2015 | $12,548 | $1,031,832 | $654,108 | $377,724 |
| 2014 | $12,218 | $1,011,621 | $641,295 | $370,326 |
Source: Public Records
Map
Nearby Homes
- 2225 Vicente St Unit 1
- 2225 Vicente St
- 2555 31st Ave
- 2139 Taraval St
- 2466 31st Ave
- 396 Crestlake Dr
- 2306 32nd Ave
- 1927 Taraval St
- 74 Everglade Dr
- 2254 30th Ave
- 2262 29th Ave
- 3400 Vicente St
- 2675 45th Ave
- 2687 45th Ave
- 2091 31st Ave
- 2170 43rd Ave
- 2078 31st Ave
- 1414 Taraval St
- 141 Meadowbrook Dr
- 2142 43rd Ave