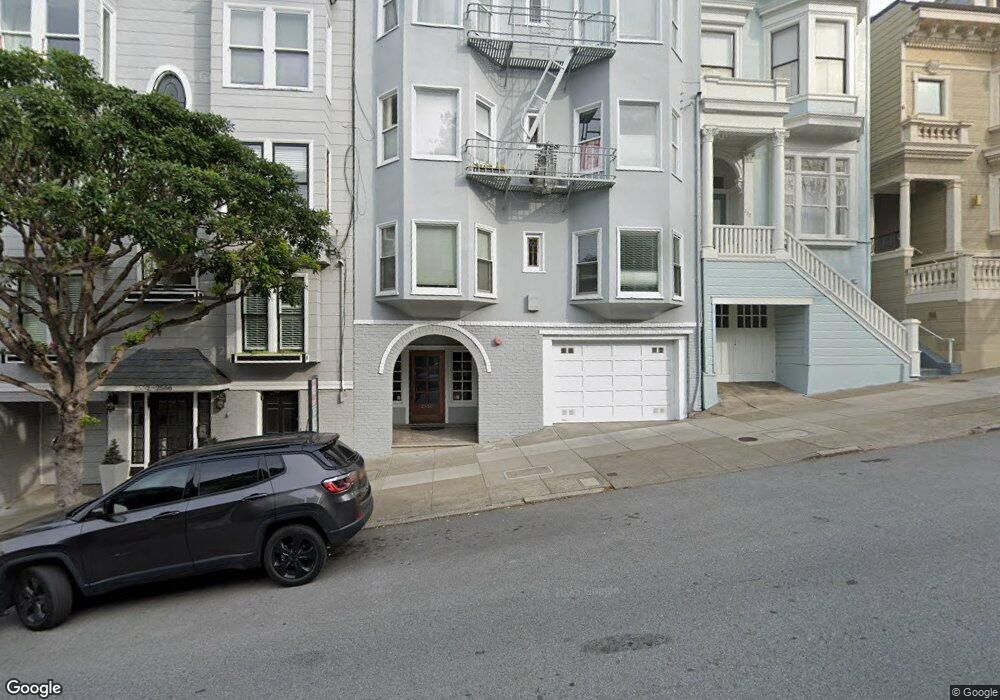
2550 Gough St Unit 6 San Francisco, CA 94123
Pacific Heights NeighborhoodEstimated Value: $957,584 - $1,347,000
--
Bed
1
Bath
1,009
Sq Ft
$1,111/Sq Ft
Est. Value
About This Home
This home is located at 2550 Gough St Unit 6, San Francisco, CA 94123 and is currently estimated at $1,120,646, approximately $1,110 per square foot. 2550 Gough St Unit 6 is a home located in San Francisco County with nearby schools including Sherman Elementary, Marina Middle School, and Mary L. Booker Leadership Academy.
Ownership History
Date
Name
Owned For
Owner Type
Purchase Details
Closed on
Aug 21, 1997
Sold by
Lieberman David S and Bloom Amy Claire
Bought by
Lotriet Andries J and Lotriet Juria A
Current Estimated Value
Home Financials for this Owner
Home Financials are based on the most recent Mortgage that was taken out on this home.
Original Mortgage
$272,850
Outstanding Balance
$40,753
Interest Rate
7.5%
Estimated Equity
$1,079,893
Purchase Details
Closed on
Apr 12, 1996
Sold by
Newbro Michael D and Routh Kristen Mehl
Bought by
Lieberman David S
Purchase Details
Closed on
Apr 12, 1994
Sold by
Rhodes Kara M
Bought by
Rhodes Adam J
Purchase Details
Closed on
Nov 20, 1993
Sold by
Sanguinetti Jane C
Bought by
Ames David C
Create a Home Valuation Report for This Property
The Home Valuation Report is an in-depth analysis detailing your home's value as well as a comparison with similar homes in the area
Home Values in the Area
Average Home Value in this Area
Purchase History
| Date | Buyer | Sale Price | Title Company |
|---|---|---|---|
| Lotriet Andries J | $321,000 | First American Title Co | |
| Lieberman David S | -- | Old Republic Title Company | |
| Rhodes Adam J | -- | Old Republic Title Company | |
| Rhodes Adam J | -- | Old Republic Title Company | |
| Ames David C | -- | Old Republic Title Company | |
| Lieberman David S | $21,500 | Old Republic Title Company |
Source: Public Records
Mortgage History
| Date | Status | Borrower | Loan Amount |
|---|---|---|---|
| Open | Lotriet Andries J | $272,850 |
Source: Public Records
Tax History Compared to Growth
Tax History
| Year | Tax Paid | Tax Assessment Tax Assessment Total Assessment is a certain percentage of the fair market value that is determined by local assessors to be the total taxable value of land and additions on the property. | Land | Improvement |
|---|---|---|---|---|
| 2025 | $6,761 | $512,537 | $199,584 | $312,953 |
| 2024 | $6,761 | $502,488 | $195,671 | $306,817 |
| 2023 | $6,630 | $492,636 | $191,835 | $300,801 |
| 2022 | $6,485 | $482,977 | $188,074 | $294,903 |
| 2021 | $6,367 | $473,508 | $184,387 | $289,121 |
| 2020 | $6,411 | $468,654 | $182,497 | $286,157 |
| 2019 | $6,197 | $459,466 | $178,919 | $280,547 |
| 2018 | $5,992 | $450,458 | $175,411 | $275,047 |
| 2017 | $5,623 | $441,626 | $171,972 | $269,654 |
| 2016 | $5,512 | $432,967 | $168,600 | $264,367 |
| 2015 | $5,443 | $426,464 | $166,068 | $260,396 |
| 2014 | $5,302 | $418,111 | $162,815 | $255,296 |
Source: Public Records
Map
Nearby Homes
- 1776 Green St Unit 201
- 1623 Vallejo St
- 1896 Pacific Ave Unit 202
- 1896 Pacific Ave Unit 404
- 1940 Broadway Unit 2W
- 1568 Union St Unit 301
- 2145 Franklin St Unit 1
- 1998 Vallejo St Unit 2
- 1880 Jackson St Unit 405
- 1971 Broadway
- 2525 Van Ness Ave Unit 502
- 2525 Van Ness Ave Unit 601
- 2160 Van Ness Ave
- 1501 Filbert St Unit PH7F
- 1671 Greenwich St
- 1438 Green St Unit 3D
- 2040 Franklin St Unit 502
- 2949 Octavia St Unit 2951
- 2000 Washington St Unit 4
- 2918 Gough St
- 2556 Gough St Unit A
- 2554 Gough St Unit A
- 2554 Gough St
- 2556A Gough St
- 2556 Gough St
- 2554A Gough St
- 2552A Gough St Unit 2552A
- 2552 Gough St
- 2550 Gough St Unit 1
- 2550 Gough St Unit 5
- 2550 Gough St Unit 4
- 2550 Gough St Unit 2
- 2524 Gough St Unit 2526
- 2520 Gough St
- 2518 Gough St
- 2516 Gough St
- 1661 Green St
- 2604 Gough St
- 2514 Gough St
- 2533 Gough St