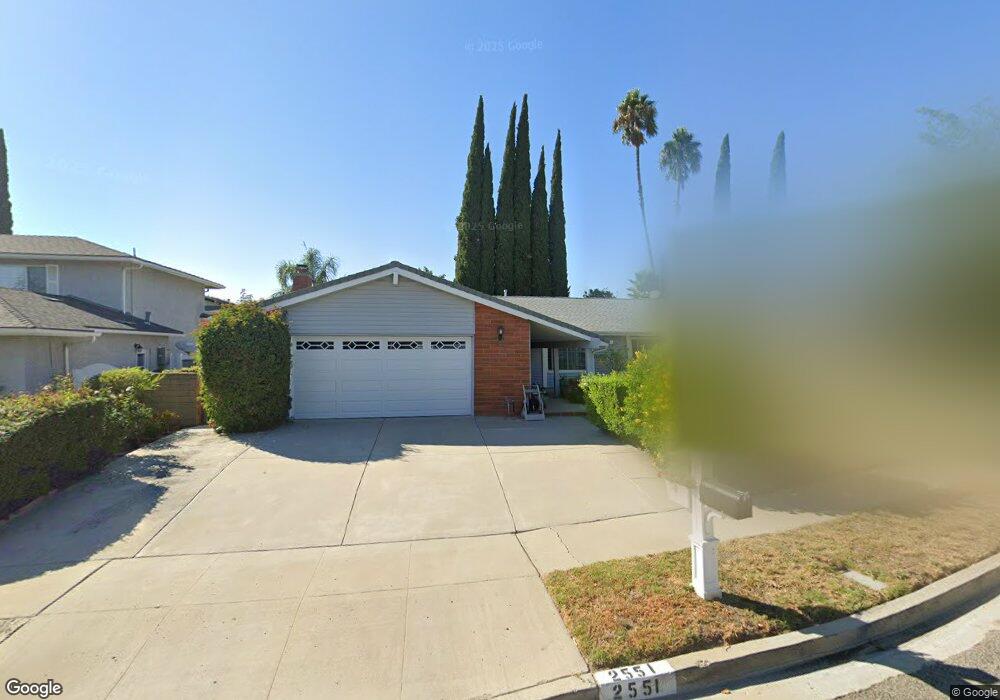
2551 N Phyllis St Simi Valley, CA 93065
Central Simi Valley NeighborhoodEstimated Value: $757,846 - $822,000
4
Beds
2
Baths
1,806
Sq Ft
$439/Sq Ft
Est. Value
About This Home
This home is located at 2551 N Phyllis St, Simi Valley, CA 93065 and is currently estimated at $792,212, approximately $438 per square foot. 2551 N Phyllis St is a home located in Ventura County with nearby schools including Park View Elementary School, Hillside Middle School, and Royal High School.
Ownership History
Date
Name
Owned For
Owner Type
Purchase Details
Closed on
Nov 3, 2011
Sold by
Howie Sanford D and Howie Eileen L
Bought by
Howie Sanford D and Howie Eileen L
Current Estimated Value
Purchase Details
Closed on
Sep 18, 2001
Sold by
Howie Sanford D and Howie Eileen L
Bought by
Howie Sanford D and Howie Eileen L
Home Financials for this Owner
Home Financials are based on the most recent Mortgage that was taken out on this home.
Original Mortgage
$211,440
Interest Rate
6.51%
Purchase Details
Closed on
Mar 5, 1997
Sold by
Smith Bryan E and Smith Toke C
Bought by
Howie Stanford D and Howie Eileen L
Home Financials for this Owner
Home Financials are based on the most recent Mortgage that was taken out on this home.
Original Mortgage
$188,490
Interest Rate
7.56%
Mortgage Type
VA
Create a Home Valuation Report for This Property
The Home Valuation Report is an in-depth analysis detailing your home's value as well as a comparison with similar homes in the area
Home Values in the Area
Average Home Value in this Area
Purchase History
| Date | Buyer | Sale Price | Title Company |
|---|---|---|---|
| Howie Sanford D | -- | None Available | |
| Howie Sanford D | -- | Fidelity National Title Co | |
| Howie Stanford D | $186,000 | First American Title Ins Co |
Source: Public Records
Mortgage History
| Date | Status | Borrower | Loan Amount |
|---|---|---|---|
| Closed | Howie Sanford D | $211,440 | |
| Previous Owner | Howie Stanford D | $188,490 |
Source: Public Records
Tax History
| Year | Tax Paid | Tax Assessment Tax Assessment Total Assessment is a certain percentage of the fair market value that is determined by local assessors to be the total taxable value of land and additions on the property. | Land | Improvement |
|---|---|---|---|---|
| 2025 | $3,966 | $302,899 | $121,155 | $181,744 |
| 2024 | $3,966 | $296,960 | $118,779 | $178,181 |
| 2023 | $3,726 | $291,138 | $116,450 | $174,688 |
| 2022 | $3,692 | $285,430 | $114,167 | $171,263 |
| 2021 | $3,649 | $279,834 | $111,929 | $167,905 |
| 2020 | $3,561 | $276,967 | $110,782 | $166,185 |
| 2019 | $3,396 | $271,537 | $108,610 | $162,927 |
| 2018 | $3,356 | $266,214 | $106,481 | $159,733 |
| 2017 | $3,272 | $260,995 | $104,394 | $156,601 |
| 2016 | $3,121 | $255,879 | $102,348 | $153,531 |
| 2015 | $3,046 | $252,037 | $100,811 | $151,226 |
| 2014 | $2,992 | $247,101 | $98,837 | $148,264 |
Source: Public Records
Map
Nearby Homes
- 2517 E Phyllis St
- 2410 N Justin Ave
- 2325 Wisteria St
- 2357 Lawnview Ct
- 2718 Licia Place
- 2313 Rynerson Ct
- 2752 Wanda Ave
- 2183 E Chesterton St
- 2489 N Greensward St
- 2293 Lupin St
- 2371 Larch St
- 2133 Cochran St
- 2235 Clover St
- 2781 N Woodrow Ave
- 2545 Belvedere Ct
- 2239 McDonald St
- 2189 Latham St
- 2405 Lee St
- 2399 Lee St
- 2727 Reservoir Dr
- 2543 N Phyllis St
- 2565 N Phyllis St
- 2552 Loretta Cir
- 2560 Loretta Cir
- 2540 Loretta Cir
- 2535 N Phyllis St
- 2430 E Phyllis St
- 2593 N Phyllis St
- 2536 Loretta Cir
- 2548 N Phyllis St
- 2411 E Phyllis St
- 2592 Loretta Cir
- 2527 N Phyllis St
- 2534 N Phyllis St
- 2442 E Phyllis St
- 2526 Loretta Cir
- 2433 E Phyllis St
- 2553 Loretta Cir
- 2520 N Phyllis St
- 2507 N Phyllis St
Your Personal Tour Guide
Ask me questions while you tour the home.