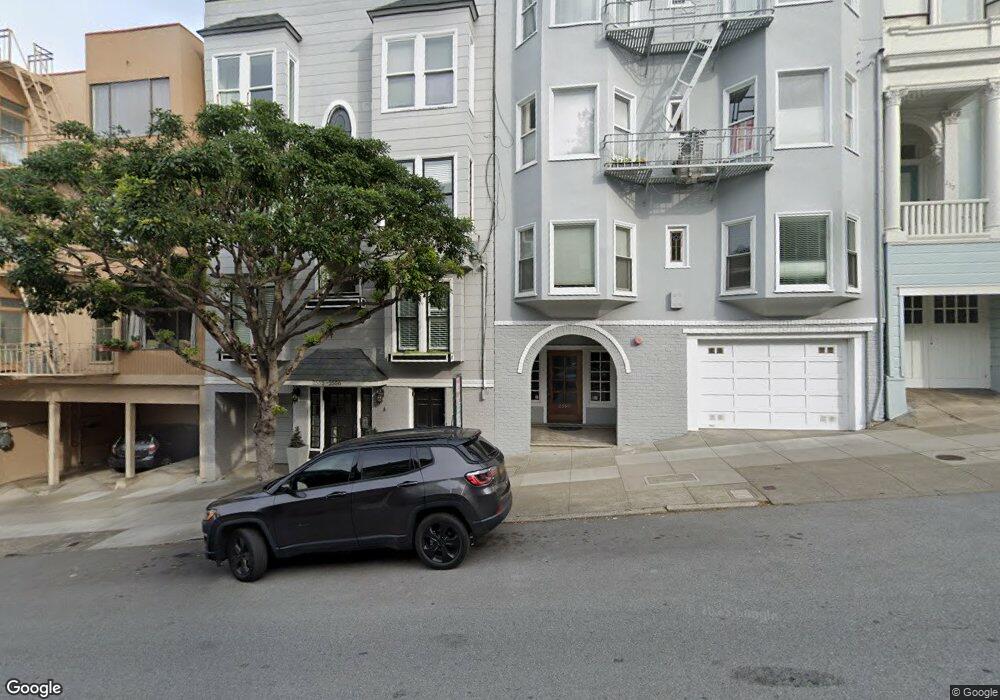
2552A Gough St Unit 2552A San Francisco, CA 94123
Pacific Heights NeighborhoodEstimated Value: $833,432 - $1,030,000
1
Bed
1
Bath
751
Sq Ft
$1,252/Sq Ft
Est. Value
About This Home
This home is located at 2552A Gough St Unit 2552A, San Francisco, CA 94123 and is currently estimated at $940,608, approximately $1,252 per square foot. 2552A Gough St Unit 2552A is a home located in San Francisco County with nearby schools including Sherman Elementary, Marina Middle School, and Mary L. Booker Leadership Academy.
Ownership History
Date
Name
Owned For
Owner Type
Purchase Details
Closed on
Jul 14, 2002
Sold by
Dowbenko Latvis T and Dowbenko Hattaya
Bought by
Dowbenko Latvis T and Dowbenko Hattaya
Current Estimated Value
Purchase Details
Closed on
Feb 26, 2001
Sold by
Gerber Marvin L and Gerber Eve L
Bought by
Latvis Lats and Dowbenko Hattaya
Home Financials for this Owner
Home Financials are based on the most recent Mortgage that was taken out on this home.
Original Mortgage
$393,750
Outstanding Balance
$141,766
Interest Rate
6.87%
Estimated Equity
$798,842
Purchase Details
Closed on
Feb 21, 2001
Sold by
Dowbenko Donald
Bought by
Dowbenko Hattaya Sawatdetz
Home Financials for this Owner
Home Financials are based on the most recent Mortgage that was taken out on this home.
Original Mortgage
$393,750
Outstanding Balance
$141,766
Interest Rate
6.87%
Estimated Equity
$798,842
Create a Home Valuation Report for This Property
The Home Valuation Report is an in-depth analysis detailing your home's value as well as a comparison with similar homes in the area
Home Values in the Area
Average Home Value in this Area
Purchase History
| Date | Buyer | Sale Price | Title Company |
|---|---|---|---|
| Dowbenko Latvis T | -- | -- | |
| Latvis Lats | $525,000 | First American Title Co | |
| Dowbenko Hattaya Sawatdetz | -- | First American Title Co |
Source: Public Records
Mortgage History
| Date | Status | Borrower | Loan Amount |
|---|---|---|---|
| Open | Latvis Lats | $393,750 |
Source: Public Records
Tax History Compared to Growth
Tax History
| Year | Tax Paid | Tax Assessment Tax Assessment Total Assessment is a certain percentage of the fair market value that is determined by local assessors to be the total taxable value of land and additions on the property. | Land | Improvement |
|---|---|---|---|---|
| 2025 | $9,960 | $754,000 | $377,000 | $377,000 |
| 2024 | $9,960 | $775,552 | $387,776 | $387,776 |
| 2023 | $9,783 | $760,348 | $380,174 | $380,174 |
| 2022 | $9,581 | $745,440 | $372,720 | $372,720 |
| 2021 | $9,410 | $730,824 | $365,412 | $365,412 |
| 2020 | $9,463 | $723,332 | $361,666 | $361,666 |
| 2019 | $9,144 | $709,152 | $354,576 | $354,576 |
| 2018 | $8,839 | $695,248 | $347,624 | $347,624 |
| 2017 | $8,437 | $681,616 | $340,808 | $340,808 |
| 2016 | $8,286 | $668,252 | $334,126 | $334,126 |
| 2015 | $8,184 | $658,216 | $329,108 | $329,108 |
| 2014 | $7,971 | $645,324 | $322,662 | $322,662 |
Source: Public Records
Map
Nearby Homes
- 1776 Green St Unit 201
- 1623 Vallejo St
- 1896 Pacific Ave Unit 202
- 1896 Pacific Ave Unit 404
- 1940 Broadway Unit 2W
- 1568 Union St Unit 301
- 2145 Franklin St Unit 1
- 1998 Vallejo St Unit 2
- 1880 Jackson St Unit 405
- 1971 Broadway
- 2525 Van Ness Ave Unit 502
- 2525 Van Ness Ave Unit 601
- 2160 Van Ness Ave
- 1501 Filbert St Unit PH7F
- 1671 Greenwich St
- 1438 Green St Unit 3D
- 2040 Franklin St Unit 502
- 2949 Octavia St Unit 2951
- 2000 Washington St Unit 4
- 2918 Gough St
- 2556 Gough St Unit A
- 2554 Gough St Unit A
- 2554 Gough St
- 2556A Gough St
- 2556 Gough St
- 2554A Gough St
- 2552 Gough St
- 2550 Gough St Unit 1
- 2550 Gough St Unit 6
- 2550 Gough St Unit 5
- 2550 Gough St Unit 4
- 2550 Gough St Unit 2
- 2524 Gough St Unit 2526
- 2520 Gough St
- 2518 Gough St
- 2516 Gough St
- 1661 Green St
- 2604 Gough St
- 2514 Gough St
- 2533 Gough St