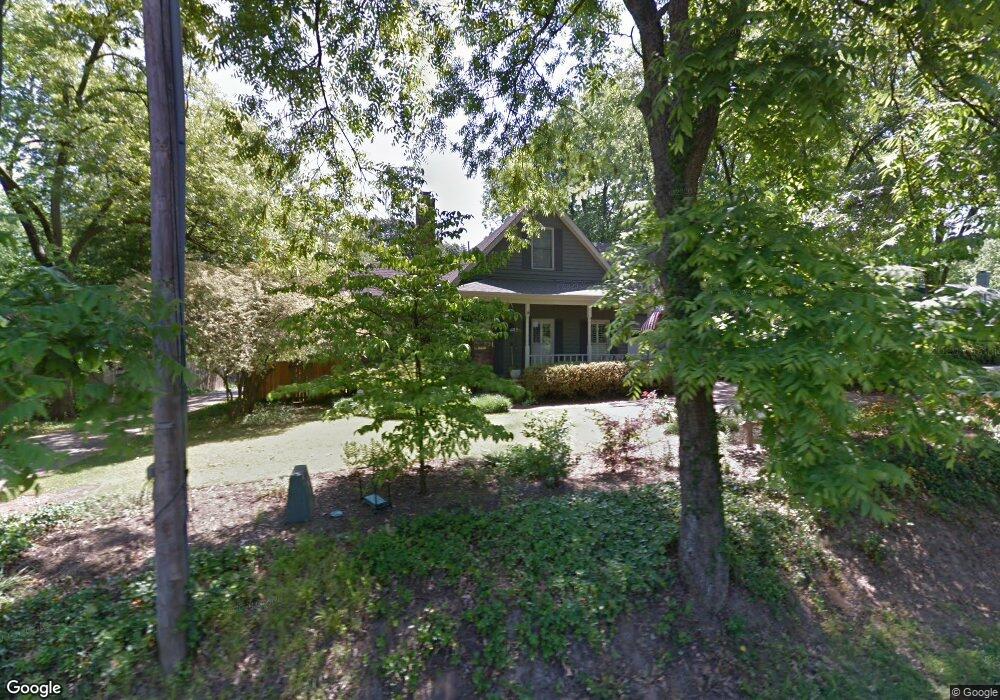
256 N Main St Collierville, TN 38017
Estimated Value: $399,000 - $496,000
4
Beds
3
Baths
2,524
Sq Ft
$178/Sq Ft
Est. Value
About This Home
This home is located at 256 N Main St, Collierville, TN 38017 and is currently estimated at $448,712, approximately $177 per square foot. 256 N Main St is a home located in Shelby County with nearby schools including Collierville Elementary School, Collierville Middle School, and Collierville High School.
Ownership History
Date
Name
Owned For
Owner Type
Purchase Details
Closed on
Sep 7, 2011
Sold by
Miller Walter P and Miller Deborah M
Bought by
Buffington Charles S and Buffington Jacy Sunshine
Current Estimated Value
Home Financials for this Owner
Home Financials are based on the most recent Mortgage that was taken out on this home.
Original Mortgage
$233,916
Outstanding Balance
$161,251
Interest Rate
4.4%
Mortgage Type
FHA
Estimated Equity
$287,461
Purchase Details
Closed on
Sep 11, 2003
Sold by
Miller Frank Lester and Miller Bobbie June
Bought by
Miller Walter P and Miller Deborah M
Home Financials for this Owner
Home Financials are based on the most recent Mortgage that was taken out on this home.
Original Mortgage
$196,650
Interest Rate
6.24%
Mortgage Type
Unknown
Purchase Details
Closed on
Jan 31, 2000
Sold by
Miller Frank L and Miller Bobbie J
Bought by
Lester Frank and Miller Bobbie June
Create a Home Valuation Report for This Property
The Home Valuation Report is an in-depth analysis detailing your home's value as well as a comparison with similar homes in the area
Home Values in the Area
Average Home Value in this Area
Purchase History
| Date | Buyer | Sale Price | Title Company |
|---|---|---|---|
| Buffington Charles S | $240,000 | Realty Title & Escrow Co Inc | |
| Miller Walter P | $207,000 | Realty Title & Escrow Co | |
| Lester Frank | -- | -- |
Source: Public Records
Mortgage History
| Date | Status | Borrower | Loan Amount |
|---|---|---|---|
| Open | Buffington Charles S | $233,916 | |
| Previous Owner | Miller Walter P | $196,650 |
Source: Public Records
Tax History Compared to Growth
Tax History
| Year | Tax Paid | Tax Assessment Tax Assessment Total Assessment is a certain percentage of the fair market value that is determined by local assessors to be the total taxable value of land and additions on the property. | Land | Improvement |
|---|---|---|---|---|
| 2025 | $3,609 | $92,225 | $14,950 | $77,275 |
| 2024 | $3,609 | $69,000 | $8,725 | $60,275 |
| 2023 | $3,609 | $69,000 | $8,725 | $60,275 |
| 2022 | $3,526 | $69,000 | $8,725 | $60,275 |
| 2021 | $3,567 | $69,000 | $8,725 | $60,275 |
| 2020 | $3,209 | $54,575 | $8,725 | $45,850 |
| 2019 | $2,210 | $54,575 | $8,725 | $45,850 |
| 2018 | $2,210 | $54,575 | $8,725 | $45,850 |
| 2017 | $2,243 | $54,575 | $8,725 | $45,850 |
| 2016 | $2,491 | $57,000 | $0 | $0 |
| 2014 | $2,491 | $57,000 | $0 | $0 |
Source: Public Records
Map
Nearby Homes
- 240 Burrows Rd
- 255 Ellawood Ln
- 275 Ellawood Ln
- 281 Briarbrook Cove
- 110 Hillwood Ln
- 284 Peterson Lake Rd
- 319 Homeville Rd
- 319 E Poplar Ave
- 146 Serenbe Cove
- 259 Washington St
- 232 W Poplar Ave
- 311 Washington St
- 151 W White Rd
- 541 Carruthers Rd
- 293 Washington St
- 437 Duscoe St
- 306 W Poplar Ave
- 406 Ashley Dr
- 549 Peterson Lake Rd
- 144 Sycamore Rd