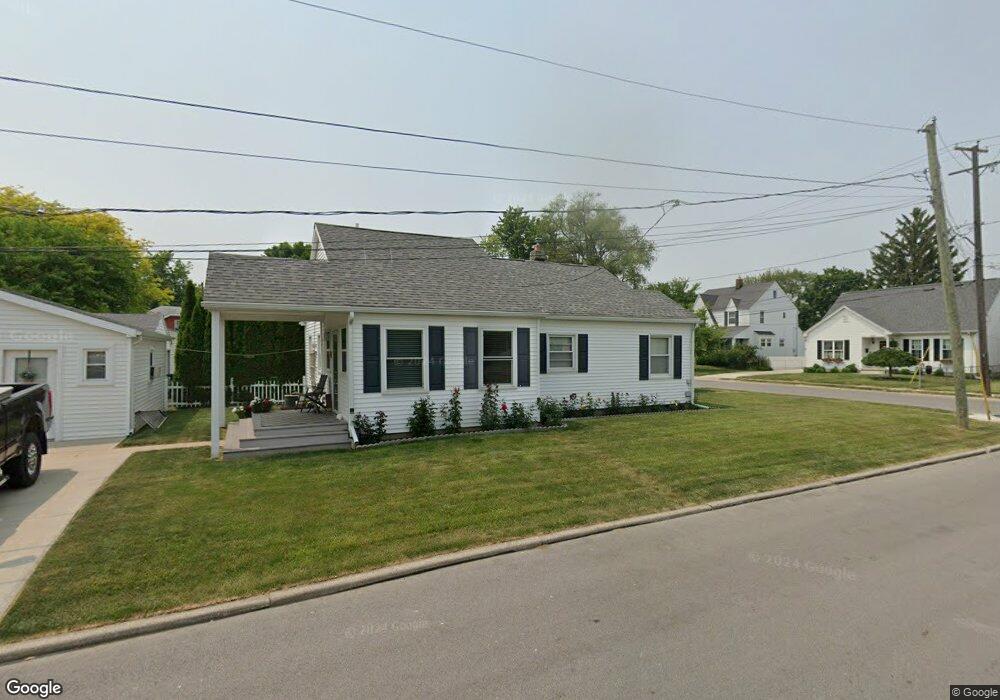
2560 116th St Toledo, OH 43611
Point Place NeighborhoodEstimated Value: $118,000 - $148,000
2
Beds
1
Bath
948
Sq Ft
$139/Sq Ft
Est. Value
About This Home
This home is located at 2560 116th St, Toledo, OH 43611 and is currently estimated at $132,230, approximately $139 per square foot. 2560 116th St is a home located in Lucas County with nearby schools including Ottawa River Elementary School, Woodward High School, and Imagine Environmental Science Academy.
Ownership History
Date
Name
Owned For
Owner Type
Purchase Details
Closed on
Nov 23, 1998
Sold by
Stevens Marilyn J
Bought by
Stevens James W
Current Estimated Value
Purchase Details
Closed on
Aug 13, 1997
Sold by
Wooden Mark S
Bought by
Stevens James W
Purchase Details
Closed on
Apr 14, 1993
Sold by
Binder Eileen H
Purchase Details
Closed on
Apr 12, 1993
Sold by
Schneider G B
Create a Home Valuation Report for This Property
The Home Valuation Report is an in-depth analysis detailing your home's value as well as a comparison with similar homes in the area
Home Values in the Area
Average Home Value in this Area
Purchase History
| Date | Buyer | Sale Price | Title Company |
|---|---|---|---|
| Stevens James W | -- | -- | |
| Stevens James W | $27,000 | -- | |
| -- | $26,000 | -- | |
| -- | -- | -- |
Source: Public Records
Tax History Compared to Growth
Tax History
| Year | Tax Paid | Tax Assessment Tax Assessment Total Assessment is a certain percentage of the fair market value that is determined by local assessors to be the total taxable value of land and additions on the property. | Land | Improvement |
|---|---|---|---|---|
| 2024 | $732 | $31,325 | $7,315 | $24,010 |
| 2023 | $1,120 | $24,185 | $6,335 | $17,850 |
| 2022 | $1,145 | $24,185 | $6,335 | $17,850 |
| 2021 | $1,156 | $24,185 | $6,335 | $17,850 |
| 2020 | $1,015 | $19,880 | $5,215 | $14,665 |
| 2019 | $975 | $19,880 | $5,215 | $14,665 |
| 2018 | $1,551 | $19,880 | $5,215 | $14,665 |
| 2017 | $1,522 | $18,340 | $5,180 | $13,160 |
| 2016 | $1,538 | $52,400 | $14,800 | $37,600 |
| 2015 | $1,529 | $52,400 | $14,800 | $37,600 |
| 2014 | $1,017 | $16,170 | $5,180 | $10,990 |
| 2013 | $1,017 | $16,170 | $5,180 | $10,990 |
Source: Public Records
Map
Nearby Homes