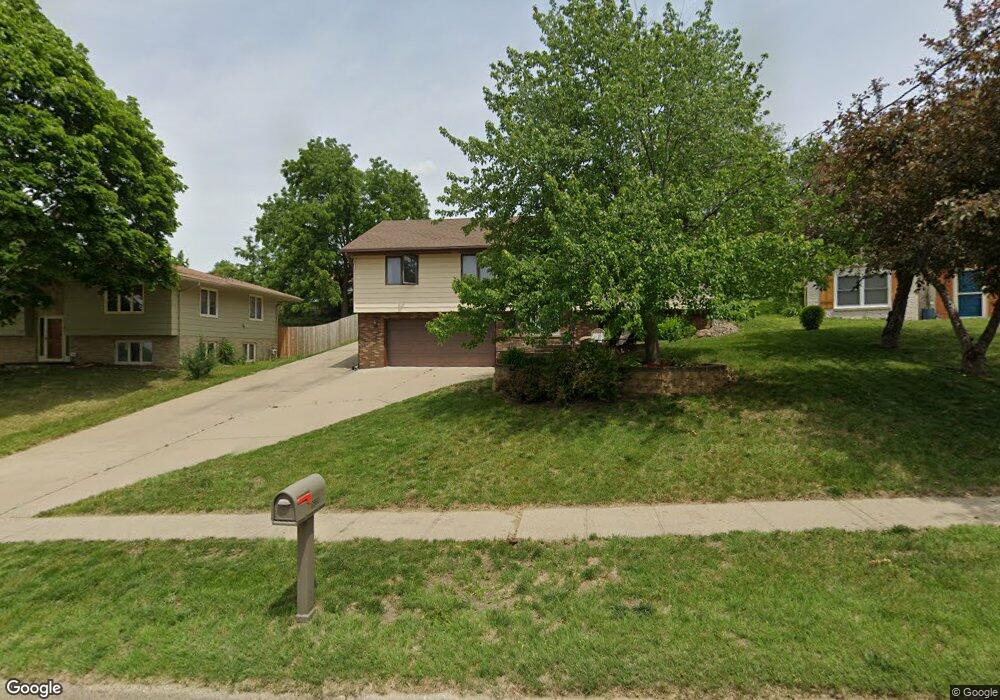
2560 Boyd St Des Moines, IA 50317
Fairmont Park NeighborhoodEstimated Value: $237,000 - $267,277
3
Beds
2
Baths
1,332
Sq Ft
$190/Sq Ft
Est. Value
About This Home
This home is located at 2560 Boyd St, Des Moines, IA 50317 and is currently estimated at $252,569, approximately $189 per square foot. 2560 Boyd St is a home located in Polk County with nearby schools including Garton Elementary School, Goodrell Middle School, and North High School.
Ownership History
Date
Name
Owned For
Owner Type
Purchase Details
Closed on
Apr 18, 2013
Sold by
Nash Ryan
Bought by
Nash Ryan and Nash Lisa
Current Estimated Value
Purchase Details
Closed on
May 17, 2012
Sold by
Nash Tracy M
Bought by
Nash Ryan R
Home Financials for this Owner
Home Financials are based on the most recent Mortgage that was taken out on this home.
Original Mortgage
$131,300
Outstanding Balance
$92,450
Interest Rate
4.25%
Mortgage Type
FHA
Estimated Equity
$160,119
Purchase Details
Closed on
Apr 11, 2011
Sold by
Smith Russell William and Vick Smith Melissa
Bought by
Nash Ryan R and Nash Tracy M
Home Financials for this Owner
Home Financials are based on the most recent Mortgage that was taken out on this home.
Original Mortgage
$133,000
Interest Rate
4.25%
Mortgage Type
New Conventional
Purchase Details
Closed on
Sep 13, 2000
Sold by
Utter Robert G and Utter Robert Graham
Bought by
Smith Russell William
Create a Home Valuation Report for This Property
The Home Valuation Report is an in-depth analysis detailing your home's value as well as a comparison with similar homes in the area
Home Values in the Area
Average Home Value in this Area
Purchase History
| Date | Buyer | Sale Price | Title Company |
|---|---|---|---|
| Nash Ryan | -- | None Available | |
| Nash Ryan R | -- | None Available | |
| Nash Ryan R | -- | None Available | |
| Nash Ryan R | $149,500 | Itc | |
| Smith Russell William | -- | -- |
Source: Public Records
Mortgage History
| Date | Status | Borrower | Loan Amount |
|---|---|---|---|
| Open | Nash Ryan R | $131,300 | |
| Closed | Nash Ryan R | $133,000 |
Source: Public Records
Tax History Compared to Growth
Tax History
| Year | Tax Paid | Tax Assessment Tax Assessment Total Assessment is a certain percentage of the fair market value that is determined by local assessors to be the total taxable value of land and additions on the property. | Land | Improvement |
|---|---|---|---|---|
| 2025 | $4,460 | $258,000 | $40,500 | $217,500 |
| 2024 | $4,460 | $237,200 | $36,100 | $201,100 |
| 2023 | $4,684 | $237,200 | $36,100 | $201,100 |
| 2022 | $4,646 | $207,600 | $32,200 | $175,400 |
| 2021 | $4,464 | $207,600 | $32,200 | $175,400 |
| 2020 | $4,632 | $187,500 | $29,200 | $158,300 |
| 2019 | $4,178 | $187,500 | $29,200 | $158,300 |
| 2018 | $4,130 | $164,000 | $25,100 | $138,900 |
| 2017 | $3,888 | $164,000 | $25,100 | $138,900 |
| 2016 | $3,784 | $152,300 | $22,800 | $129,500 |
| 2015 | $3,784 | $152,300 | $22,800 | $129,500 |
| 2014 | $3,744 | $149,600 | $23,100 | $126,500 |
Source: Public Records
Map
Nearby Homes
- 2633 Grandview Ave
- 2560 E Sheridan Ave
- 2718 Richmond Ave
- 2719 E Tiffin Ave
- 3218 E 26th St
- 2722 E Tiffin Ave
- 2680 Hull Ave
- 2809 E 24th St
- 2511 E Ovid Ave
- 3315 E 25th St
- 2817 Richmond Ave
- 2407 E Tiffin Ave
- 2622 E 29th St
- 2704 Wedgewood Rd
- 2737 E Euclid Ave
- 2736 E Euclid Ave
- 2936 E Tiffin Ave
- 2323 E 23rd St
- 2622 John Patterson Rd
- 2324 E 23rd St