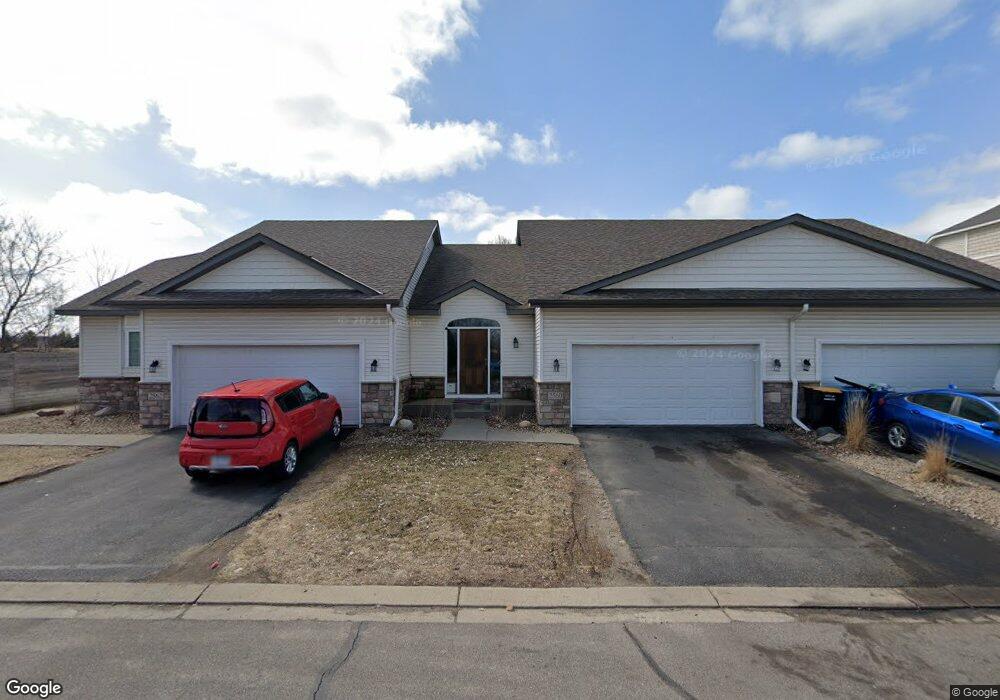
2560 Vierling Dr E Shakopee, MN 55379
Estimated Value: $291,154 - $307,000
3
Beds
3
Baths
2,148
Sq Ft
$139/Sq Ft
Est. Value
About This Home
This home is located at 2560 Vierling Dr E, Shakopee, MN 55379 and is currently estimated at $299,289, approximately $139 per square foot. 2560 Vierling Dr E is a home located in Scott County with nearby schools including Sun Path Elementary School, Shakopee West Middle School, and Shakopee Senior High School.
Ownership History
Date
Name
Owned For
Owner Type
Purchase Details
Closed on
Oct 28, 2021
Sold by
Duku Simon
Bought by
Vierling Estates 1St Addition Hoa
Current Estimated Value
Purchase Details
Closed on
Nov 17, 2020
Sold by
Waconia Development Llc
Bought by
Duku Simon
Home Financials for this Owner
Home Financials are based on the most recent Mortgage that was taken out on this home.
Original Mortgage
$244,150
Interest Rate
2.8%
Mortgage Type
New Conventional
Purchase Details
Closed on
Apr 27, 2012
Sold by
Willenbring Companies Inc
Bought by
Waconia Development Llc
Home Financials for this Owner
Home Financials are based on the most recent Mortgage that was taken out on this home.
Original Mortgage
$505,074
Interest Rate
3.91%
Mortgage Type
Purchase Money Mortgage
Create a Home Valuation Report for This Property
The Home Valuation Report is an in-depth analysis detailing your home's value as well as a comparison with similar homes in the area
Home Values in the Area
Average Home Value in this Area
Purchase History
| Date | Buyer | Sale Price | Title Company |
|---|---|---|---|
| Vierling Estates 1St Addition Hoa | $6,223 | None Available | |
| Duku Simon | $257,000 | Titlesmart Inc | |
| Waconia Development Llc | -- | Title Mark | |
| Duku Simon Simon | $257,000 | -- |
Source: Public Records
Mortgage History
| Date | Status | Borrower | Loan Amount |
|---|---|---|---|
| Previous Owner | Duku Simon | $244,150 | |
| Previous Owner | Waconia Development Llc | $505,074 | |
| Closed | Duku Simon Simon | $242,335 |
Source: Public Records
Tax History
| Year | Tax Paid | Tax Assessment Tax Assessment Total Assessment is a certain percentage of the fair market value that is determined by local assessors to be the total taxable value of land and additions on the property. | Land | Improvement |
|---|---|---|---|---|
| 2025 | $2,690 | $266,700 | $72,300 | $194,400 |
| 2024 | $2,730 | $254,500 | $68,800 | $185,700 |
| 2023 | $2,792 | $254,400 | $71,000 | $183,400 |
| 2022 | $2,604 | $256,100 | $72,700 | $183,400 |
| 2021 | $2,332 | $204,500 | $57,000 | $147,500 |
| 2020 | $2,528 | $200,200 | $52,500 | $147,700 |
| 2019 | $2,402 | $190,600 | $44,400 | $146,200 |
| 2018 | $2,388 | $0 | $0 | $0 |
| 2016 | $2,248 | $0 | $0 | $0 |
| 2014 | -- | $0 | $0 | $0 |
Source: Public Records
Map
Nearby Homes
- 2351 Tyrone Dr
- 2006 Tyrone Dr
- 2399 Tyrone Dr
- 2423 Tyrone Dr
- 2817 Downing Ave
- 2795 Downing Ave
- 1542 Philipp Way
- 1596 Chartreux Ave
- 2871 Trinity Dr
- 2350 Downing Ave
- 2868 Trinity Dr
- 1182 Limestone Dr S
- 1691 Tyrone Dr
- 1658 Tyrone Dr
- 2931 Trinity Dr
- 1928 Vierling Dr E
- 2655 King Ave
- 1624 Philipp Way
- 1817 Ruby Cir
- 1515 Philipp Way
- 2558 Vierling Dr E
- 2562 Vierling Dr E
- 2554 Vierling Dr E
- 2568 Vierling Dr E
- 2552 Vierling Dr E
- 2572 Vierling Dr E
- 2550 Vierling Dr E
- 2566 Vierling Dr E
- 2576 Vierling Dr E
- 2570 Vierling Dr E
- 2580 Vierling Dr E
- 2578 Vierling Dr E
- 2588 Vierling Dr E
- 2586 Vierling Dr E
- 2592 Vierling Dr E
- 2590 Vierling Dr E
- 2596 Vierling Dr E
- 2594 Vierling Dr E
- 2488 Vierling Dr E
- 2544 Onyx Dr
Your Personal Tour Guide
Ask me questions while you tour the home.