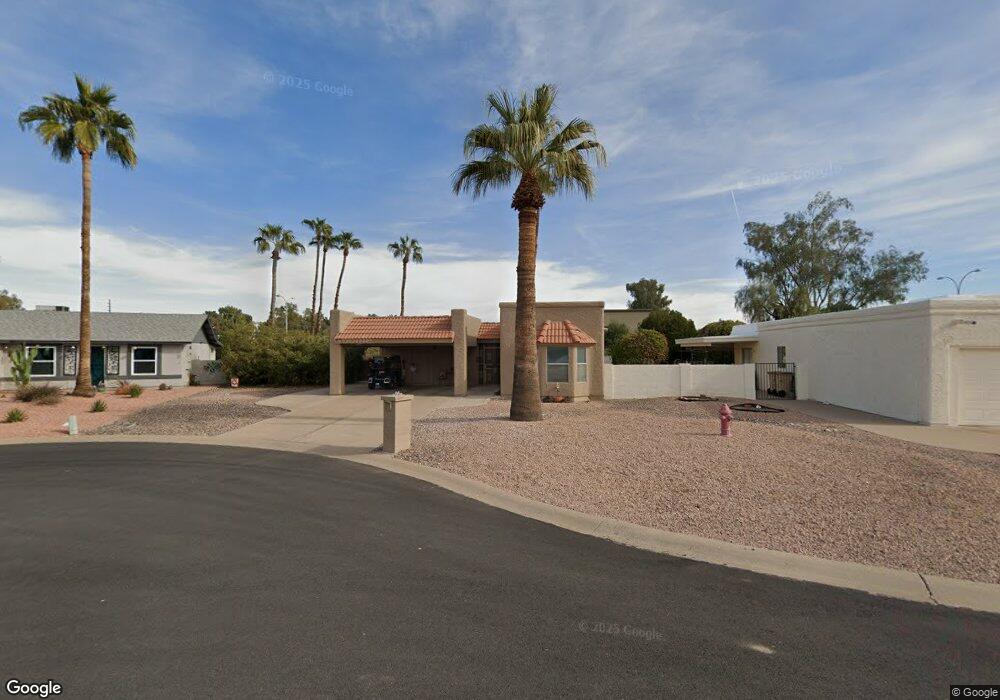
25615 S Fairway Ct Sun Lakes, AZ 85248
Estimated Value: $318,000 - $360,000
2
Beds
2
Baths
1,348
Sq Ft
$252/Sq Ft
Est. Value
About This Home
This home is located at 25615 S Fairway Ct, Sun Lakes, AZ 85248 and is currently estimated at $339,943, approximately $252 per square foot. 25615 S Fairway Ct is a home located in Maricopa County with nearby schools including Jacobson Elementary School, Hamilton High School, and Bogle Junior High School.
Ownership History
Date
Name
Owned For
Owner Type
Purchase Details
Closed on
Jun 6, 2025
Sold by
Robinson Patricia and Birch Patricia
Bought by
Birch Patricia R
Current Estimated Value
Home Financials for this Owner
Home Financials are based on the most recent Mortgage that was taken out on this home.
Original Mortgage
$460,500
Outstanding Balance
$439,668
Interest Rate
8.8%
Mortgage Type
Reverse Mortgage Home Equity Conversion Mortgage
Estimated Equity
-$99,725
Purchase Details
Closed on
Jan 10, 2025
Sold by
Rothbury Llc
Bought by
Birch Patricia and Robinson Patricia
Purchase Details
Closed on
May 20, 2019
Sold by
Robinson Patricia and Robinson Birch Patricia
Bought by
Rothbury Llc
Purchase Details
Closed on
May 5, 2004
Sold by
Schannon Stanley A
Bought by
Robinson Patricia
Purchase Details
Closed on
Aug 19, 1999
Sold by
Schannon Stanley A and Schannon Irene
Bought by
Stanley & Irene Schannon Family Trust
Create a Home Valuation Report for This Property
The Home Valuation Report is an in-depth analysis detailing your home's value as well as a comparison with similar homes in the area
Home Values in the Area
Average Home Value in this Area
Purchase History
| Date | Buyer | Sale Price | Title Company |
|---|---|---|---|
| Birch Patricia R | -- | None Listed On Document | |
| Birch Patricia | -- | None Listed On Document | |
| Rothbury Llc | -- | None Available | |
| Robinson Patricia | $124,000 | Transnation Title | |
| Stanley & Irene Schannon Family Trust | -- | -- |
Source: Public Records
Mortgage History
| Date | Status | Borrower | Loan Amount |
|---|---|---|---|
| Open | Birch Patricia R | $460,500 | |
| Closed | Birch Patricia R | $460,500 |
Source: Public Records
Tax History Compared to Growth
Tax History
| Year | Tax Paid | Tax Assessment Tax Assessment Total Assessment is a certain percentage of the fair market value that is determined by local assessors to be the total taxable value of land and additions on the property. | Land | Improvement |
|---|---|---|---|---|
| 2025 | $1,816 | $15,941 | -- | -- |
| 2024 | $1,817 | $15,181 | -- | -- |
| 2023 | $1,817 | $26,420 | $5,280 | $21,140 |
| 2022 | $1,739 | $19,460 | $3,890 | $15,570 |
| 2021 | $1,755 | $18,100 | $3,620 | $14,480 |
| 2020 | $1,733 | $16,750 | $3,350 | $13,400 |
| 2019 | $1,463 | $14,260 | $2,850 | $11,410 |
| 2018 | $1,405 | $13,070 | $2,610 | $10,460 |
| 2017 | $1,312 | $11,960 | $2,390 | $9,570 |
| 2016 | $1,283 | $11,900 | $2,380 | $9,520 |
| 2015 | $1,227 | $10,970 | $2,190 | $8,780 |
Source: Public Records
Map
Nearby Homes
- 9119 E Fairway Blvd Unit 3A
- 9239 E Fairway Blvd
- 25415 S Ohio Ct
- 9022 E Minnesota Ave
- 9044 E Sun Lakes Blvd N
- 9031 E Coopers Hawk Dr
- 9339 E Sun Lakes Blvd N Unit 6
- 9358 E Olive Ln N Unit 6
- 24907 S Lakestar Dr
- 8940 E Indiana Ave
- 9426 E Minnesota Ave
- 9205 E Citrus Ln N
- 9029 E Nacoma Dr
- 8913 E Minnesota Ave Unit 41
- 9222 E Nacoma Dr
- 8911 E Indiana Ave
- 8905 E Indiana Ave
- 8914 E Copper Valley Ln Unit 41
- 9443 E Lawndale Place
- 9502 E Lawndale Place Unit 9
- 25615 S Fairway Ct Unit 3A050
- 25621 S Fairway Ct
- 25603 S Fairway Ct
- 25627 S Fairway Ct
- 25602 S Fairway Ct
- 9149 E Ohio Ave Unit 3A/033
- 9149 E Ohio Ave Unit 3
- 9149 E Ohio Ave Unit 3A
- 25614 S Fairway Ct
- 9145 E Ohio Ave
- 25620 S Fairway Ct
- 25608 S Fairway Ct
- 9139 E Ohio Ave
- 25626 S Fairway Ct
- 9135 E Ohio Ave
- 9155 E Fairway Blvd
- 9149 E Fairway Blvd
- 25615 S Kansas Ave Unit 3A
- 25609 S Kansas Ave
- 9129 E Ohio Ave