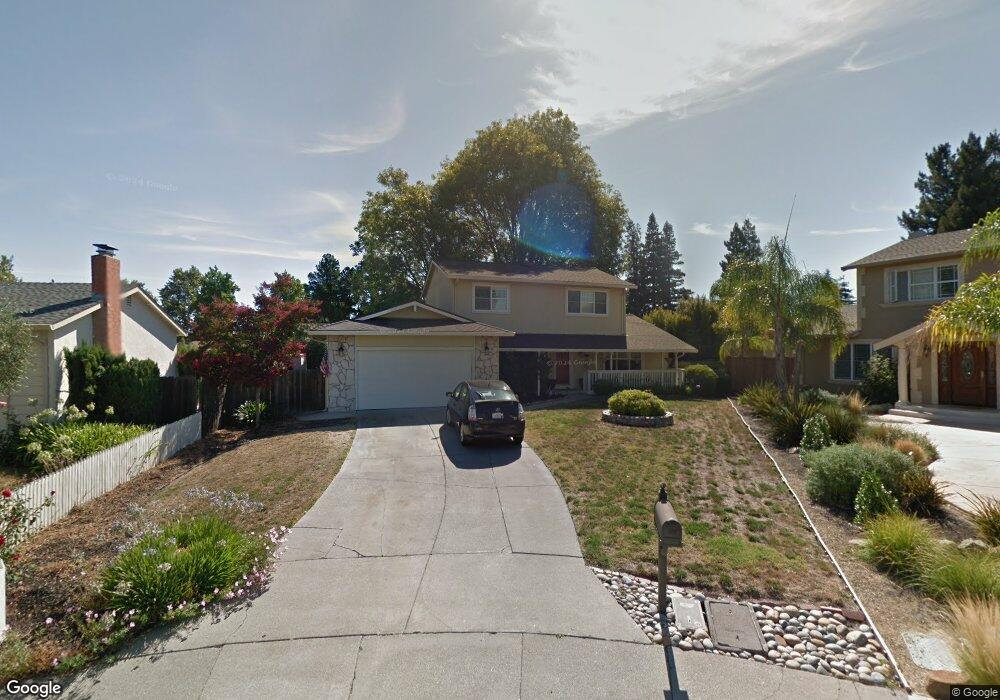
2564 Shadow Mountain Ct San Ramon, CA 94583
Twin Creeks NeighborhoodEstimated Value: $1,519,382 - $1,751,000
4
Beds
3
Baths
2,075
Sq Ft
$800/Sq Ft
Est. Value
About This Home
This home is located at 2564 Shadow Mountain Ct, San Ramon, CA 94583 and is currently estimated at $1,660,596, approximately $800 per square foot. 2564 Shadow Mountain Ct is a home located in Contra Costa County with nearby schools including Twin Creeks Elementary School, Iron Horse Middle School, and California High School.
Ownership History
Date
Name
Owned For
Owner Type
Purchase Details
Closed on
Apr 27, 2021
Sold by
Ventimiglia Mario J and Ventimiglia Cheryl
Bought by
Ventimiglia Mario J and Ventimiglia Chery L
Current Estimated Value
Purchase Details
Closed on
Dec 17, 2015
Sold by
Ventimiglia Mario J and Ventmiglian Cheryl
Bought by
Ventimiglia Mario J and Ventmiglia Cheryl
Home Financials for this Owner
Home Financials are based on the most recent Mortgage that was taken out on this home.
Original Mortgage
$498,960
Outstanding Balance
$394,986
Interest Rate
3.9%
Mortgage Type
New Conventional
Estimated Equity
$1,265,610
Purchase Details
Closed on
Mar 12, 1999
Sold by
Twin Creeks Garden Home Owners Assn Inc
Bought by
Ventimiglia Mario J and Ventimiglia Cheryl
Create a Home Valuation Report for This Property
The Home Valuation Report is an in-depth analysis detailing your home's value as well as a comparison with similar homes in the area
Home Values in the Area
Average Home Value in this Area
Purchase History
| Date | Buyer | Sale Price | Title Company |
|---|---|---|---|
| Ventimiglia Mario J | -- | None Available | |
| Ventimiglia Mario J | -- | Linear Title & Closing | |
| Ventimiglia Mario J | -- | -- |
Source: Public Records
Mortgage History
| Date | Status | Borrower | Loan Amount |
|---|---|---|---|
| Open | Ventimiglia Mario J | $498,960 |
Source: Public Records
Tax History Compared to Growth
Tax History
| Year | Tax Paid | Tax Assessment Tax Assessment Total Assessment is a certain percentage of the fair market value that is determined by local assessors to be the total taxable value of land and additions on the property. | Land | Improvement |
|---|---|---|---|---|
| 2025 | $5,861 | $461,261 | $229,673 | $231,588 |
| 2024 | $5,755 | $452,218 | $225,170 | $227,048 |
| 2023 | $5,755 | $443,352 | $220,755 | $222,597 |
| 2022 | $5,710 | $434,660 | $216,427 | $218,233 |
| 2021 | $5,580 | $426,138 | $212,184 | $213,954 |
| 2019 | $5,436 | $413,501 | $205,892 | $207,609 |
| 2018 | $5,233 | $405,394 | $201,855 | $203,539 |
| 2017 | $5,037 | $397,447 | $197,898 | $199,549 |
| 2016 | $4,956 | $389,655 | $194,018 | $195,637 |
| 2015 | $4,879 | $383,803 | $191,104 | $192,699 |
| 2014 | $4,798 | $376,286 | $187,361 | $188,925 |
Source: Public Records
Map
Nearby Homes
- 560 La Copita Ct
- 2692 Shadow Mountain Dr
- 205 Compton Cir Unit B
- 412 Carillo Ct
- 2782 Canyon Creek Dr
- 2720 Marsh Dr
- 408 Fernando Ct
- 600 Guaymas Ct
- 121 Skyline Dr Unit 5
- 437 Ryan Terrace
- 2632 Campeche Ct
- 732 Fountainhead Ct
- 216 Stone Pine Ln
- 334 La Paz Ct
- 2857 Fountainhead Dr
- 2809 Fountainhead Dr
- 2749 Fountainhead Dr
- 219 Forest Creek Ln
- 305 Daybreak Ct
- 1204 Destiny Ln
- 2572 Shadow Mountain Ct
- 562 La Copita Ct
- 564 La Copita Ct
- 566 La Copita Ct
- 558 La Copita Ct
- 2556 Shadow Mountain Ct
- 2644 Shadow Mountain Dr
- 2624 Shadow Mountain Dr
- 2620 Shadow Mountain Dr
- 2648 Shadow Mountain Dr
- 554 La Copita Ct
- 2640 Shadow Mountain Dr
- 2571 Shadow Mountain Ct
- 2616 Shadow Mountain Dr
- 552 La Copita Ct
- 2652 Shadow Mountain Dr
- 2548 Shadow Mountain Ct
- 2636 Shadow Mountain Dr
- 550 La Copita Ct
- 2565 Shadow Mountain Ct