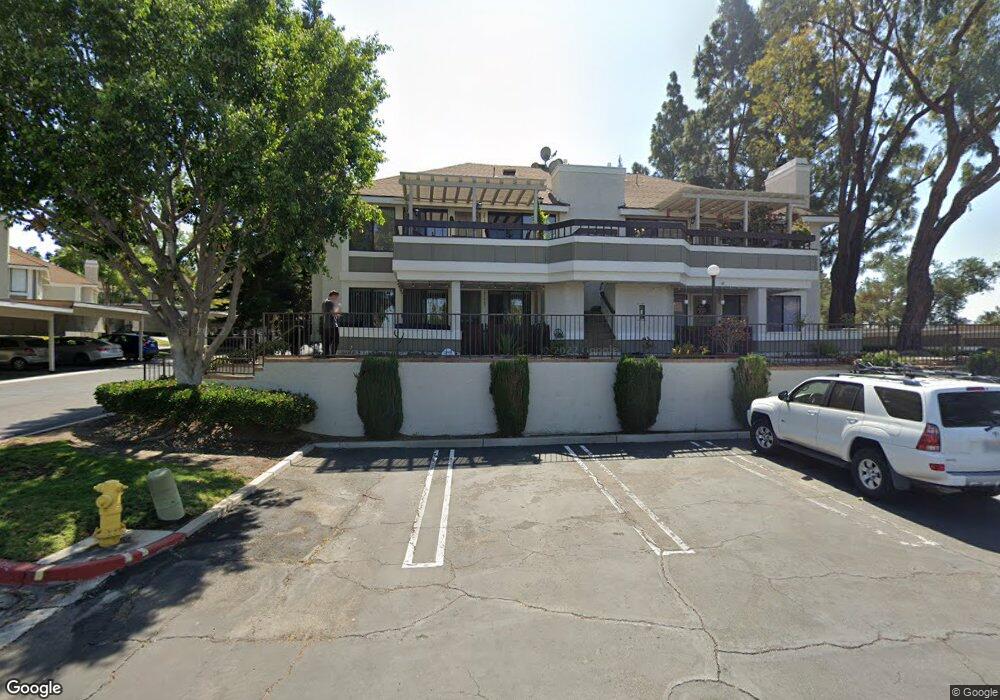
25665 View Pointe Unit 10G Lake Forest, CA 92630
Estimated Value: $529,000 - $582,000
2
Beds
1
Bath
957
Sq Ft
$580/Sq Ft
Est. Value
About This Home
This home is located at 25665 View Pointe Unit 10G, Lake Forest, CA 92630 and is currently estimated at $554,589, approximately $579 per square foot. 25665 View Pointe Unit 10G is a home located in Orange County with nearby schools including La Madera Elementary School, Serrano Intermediate School, and El Toro High School.
Ownership History
Date
Name
Owned For
Owner Type
Purchase Details
Closed on
Aug 25, 2006
Sold by
Nowacki Theresa
Bought by
Nowacki Kris
Current Estimated Value
Home Financials for this Owner
Home Financials are based on the most recent Mortgage that was taken out on this home.
Original Mortgage
$324,000
Outstanding Balance
$130,212
Interest Rate
1%
Mortgage Type
Negative Amortization
Estimated Equity
$424,377
Purchase Details
Closed on
Nov 30, 1993
Sold by
Kehoe Kathy A
Bought by
Nowacki Kris and Nowacki Theresa
Home Financials for this Owner
Home Financials are based on the most recent Mortgage that was taken out on this home.
Original Mortgage
$102,000
Interest Rate
7.38%
Mortgage Type
FHA
Create a Home Valuation Report for This Property
The Home Valuation Report is an in-depth analysis detailing your home's value as well as a comparison with similar homes in the area
Home Values in the Area
Average Home Value in this Area
Purchase History
| Date | Buyer | Sale Price | Title Company |
|---|---|---|---|
| Nowacki Kris | -- | Investors Title Company | |
| Nowacki Kris | $105,000 | Investors Title Company |
Source: Public Records
Mortgage History
| Date | Status | Borrower | Loan Amount |
|---|---|---|---|
| Open | Nowacki Kris | $324,000 | |
| Closed | Nowacki Kris | $102,000 |
Source: Public Records
Tax History Compared to Growth
Tax History
| Year | Tax Paid | Tax Assessment Tax Assessment Total Assessment is a certain percentage of the fair market value that is determined by local assessors to be the total taxable value of land and additions on the property. | Land | Improvement |
|---|---|---|---|---|
| 2025 | $1,761 | $178,284 | $74,279 | $104,005 |
| 2024 | $1,761 | $174,789 | $72,823 | $101,966 |
| 2023 | $1,719 | $171,362 | $71,395 | $99,967 |
| 2022 | $1,687 | $168,002 | $69,995 | $98,007 |
| 2021 | $1,652 | $164,708 | $68,622 | $96,086 |
| 2020 | $1,636 | $163,020 | $67,919 | $95,101 |
| 2019 | $1,603 | $159,824 | $66,587 | $93,237 |
| 2018 | $1,571 | $156,691 | $65,282 | $91,409 |
| 2017 | $1,539 | $153,619 | $64,002 | $89,617 |
| 2016 | $1,512 | $150,607 | $62,747 | $87,860 |
| 2015 | $1,493 | $148,345 | $61,804 | $86,541 |
| 2014 | $1,459 | $145,440 | $60,594 | $84,846 |
Source: Public Records
Map
Nearby Homes
- 22201 Center Pointe Unit 2D
- 25614 Mont Pointe Unit 3D
- 25671 Le Parc Unit 85
- 25712 Le Parc Unit 48
- 25712 Le Parc Unit 7
- 22132 Bellcroft Dr
- 25761 Le Parc Unit 82
- 25761 Le Parc
- 21991 143 Rimhurst
- 25885 Trabuco Rd Unit 41
- 25885 Trabuco Rd Unit 206
- 25885 Trabuco Rd Unit 226
- 25885 Trabuco Rd Unit 306
- 22461 Silver Spur
- 21941 Rimhurst Dr Unit D
- 21921 Rimhurst Dr Unit 130-G
- 25912 Densmore Dr
- 22722 Malaga Way
- 21841 Zuni Dr
- 22976 Broadleaf
- 25661 View Pointe Unit 10C
- 25663 View Pointe Unit 10D
- 25677 View Pointe Unit 10E
- 25675 View Pointe Unit 10F
- 25671 View Pointe Unit 10B
- 25671 View Pointe
- 25673 View Pointe Unit 10A
- 25673 View Pointe
- 25681 View Pointe
- 25683 View Pointe Unit 9D
- 25685 View Pointe Unit 9G
- 25687 View Pointe Unit 9h
- 25687 View Pointe
- 25663 Sycamore Pointe
- 25667 Sycamore Pointe Unit 2H
- 25667 Sycamore Pointe
- 25677 Sycamore Pointe Unit 2E
- 25697 View Pointe
- 25654 Mont Pointe