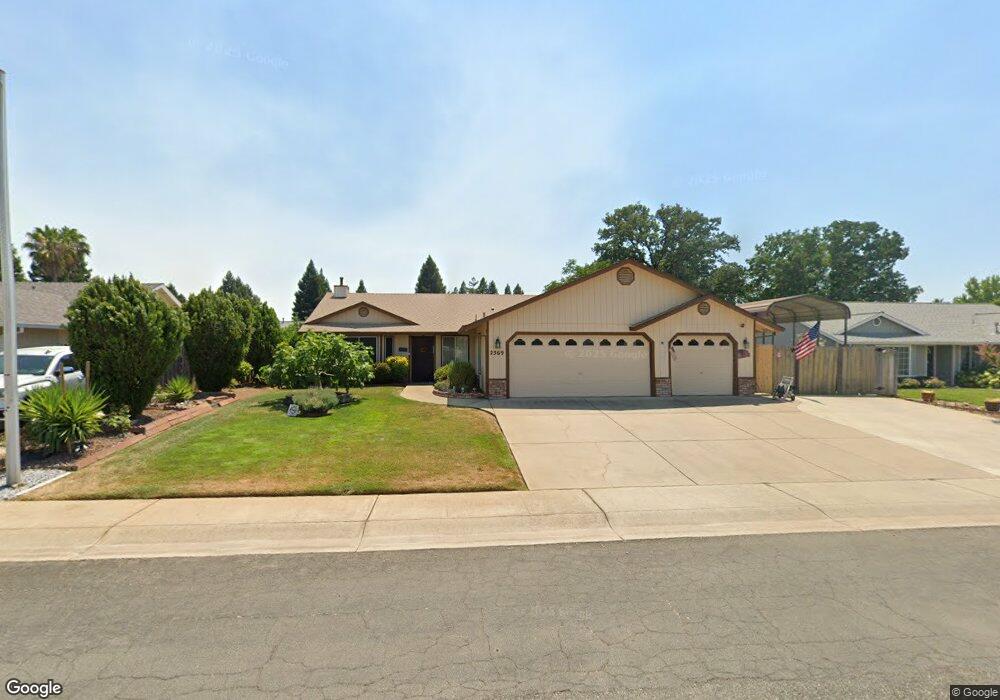
2569 Dewberry Dr Unit 9 Redding, CA 96003
North Shasta View NeighborhoodEstimated Value: $349,000 - $379,000
3
Beds
2
Baths
1,319
Sq Ft
$278/Sq Ft
Est. Value
About This Home
This home is located at 2569 Dewberry Dr Unit 9, Redding, CA 96003 and is currently estimated at $366,324, approximately $277 per square foot. 2569 Dewberry Dr Unit 9 is a home located in Shasta County with nearby schools including Columbia Elementary School, Mountain View Middle School, and Foothill High School.
Ownership History
Date
Name
Owned For
Owner Type
Purchase Details
Closed on
Mar 13, 2007
Sold by
Yerkes Jack H and Yerkes Estella G
Bought by
Yerkes John H and Yerkes Estella G
Current Estimated Value
Purchase Details
Closed on
Mar 14, 2000
Sold by
Sp Taylor Estella Glenda and Sp Estella G
Bought by
Yerkes Jack H and Yerkes Estella G
Purchase Details
Closed on
Dec 8, 1998
Sold by
Taylor Frank Edwin
Bought by
Taylor Estella Glenda
Purchase Details
Closed on
Sep 24, 1997
Sold by
Donald Lynn and Donald Darlene
Bought by
Rivinius Arnold A and Rivinius Janell L
Purchase Details
Closed on
Apr 18, 1997
Sold by
Lynn David B and Lynn Theresa M
Bought by
Lynn Donald and Lynn Darlene
Create a Home Valuation Report for This Property
The Home Valuation Report is an in-depth analysis detailing your home's value as well as a comparison with similar homes in the area
Home Values in the Area
Average Home Value in this Area
Purchase History
| Date | Buyer | Sale Price | Title Company |
|---|---|---|---|
| Yerkes John H | -- | None Available | |
| Yerkes Jack H | -- | Chicago Title Co | |
| Taylor Estella Glenda | -- | Chicago Title Co | |
| Taylor Estella Glenda | $118,000 | Chicago Title Co | |
| Rivinius Arnold A | $115,000 | Chicago Title Co | |
| Lynn Donald | $100,000 | Chicago Title Co |
Source: Public Records
Tax History
| Year | Tax Paid | Tax Assessment Tax Assessment Total Assessment is a certain percentage of the fair market value that is determined by local assessors to be the total taxable value of land and additions on the property. | Land | Improvement |
|---|---|---|---|---|
| 2025 | $1,888 | $184,963 | $39,180 | $145,783 |
| 2024 | $1,896 | $181,337 | $38,412 | $142,925 |
| 2023 | $1,896 | $177,782 | $37,659 | $140,123 |
| 2022 | $1,833 | $174,297 | $36,921 | $137,376 |
| 2021 | $1,818 | $170,881 | $36,198 | $134,683 |
| 2020 | $1,803 | $169,129 | $35,827 | $133,302 |
| 2019 | $1,761 | $165,814 | $35,125 | $130,689 |
| 2018 | $1,773 | $162,564 | $34,437 | $128,127 |
| 2017 | $1,794 | $159,377 | $33,762 | $125,615 |
| 2016 | $1,677 | $156,252 | $33,100 | $123,152 |
| 2015 | $1,651 | $153,906 | $32,603 | $121,303 |
| 2014 | $1,608 | $150,892 | $31,965 | $118,927 |
Source: Public Records
Map
Nearby Homes
- 1637 French Lace Ln
- 10033 Abernathy Ln
- 1090 Gibralter Rd
- 2385 Shining Star Way
- 10162 Harley Leighton Rd
- 2093 Victor Ave
- 965 Willow Brook Ln
- 10129 Harley Leighton Rd
- 2571 Erin Ln
- 1939 Cameo Ct
- 2295 Chelsa Cir
- 2912 Squire Ave
- 1701 E Cypress Ave
- 1110 Grouse Dr
- 1877 Wheeler St
- 2115 Hawn Ave
- 1285 Lancers Ln
- 3072 Alta Mesa Dr
- 3035 Argyle Rd
- 1556 Minor St
- 2569 Dewberry Dr
- 2563 Dewberry Dr
- 2575 Dewberry Dr
- 1814 Trumpet Dr
- 0 Dewberry Dr
- 1822 Trumpet Dr
- 1806 Trumpet Dr
- 2555 Dewberry Dr
- 2581 Dewberry Dr
- 1828 Trumpet Dr
- 2572 Dewberry Dr Unit 1
- 2572 Dewberry Dr
- 2578 Dewberry Dr
- 1796 Trumpet Dr
- 2566 Dewberry Dr
- 2543 Dewberry Dr
- 2584 Dewberry Dr Unit 1
- 2584 Dewberry Dr
- 1836 Trumpet Dr
- 2587 Dewberry Dr
Your Personal Tour Guide
Ask me questions while you tour the home.