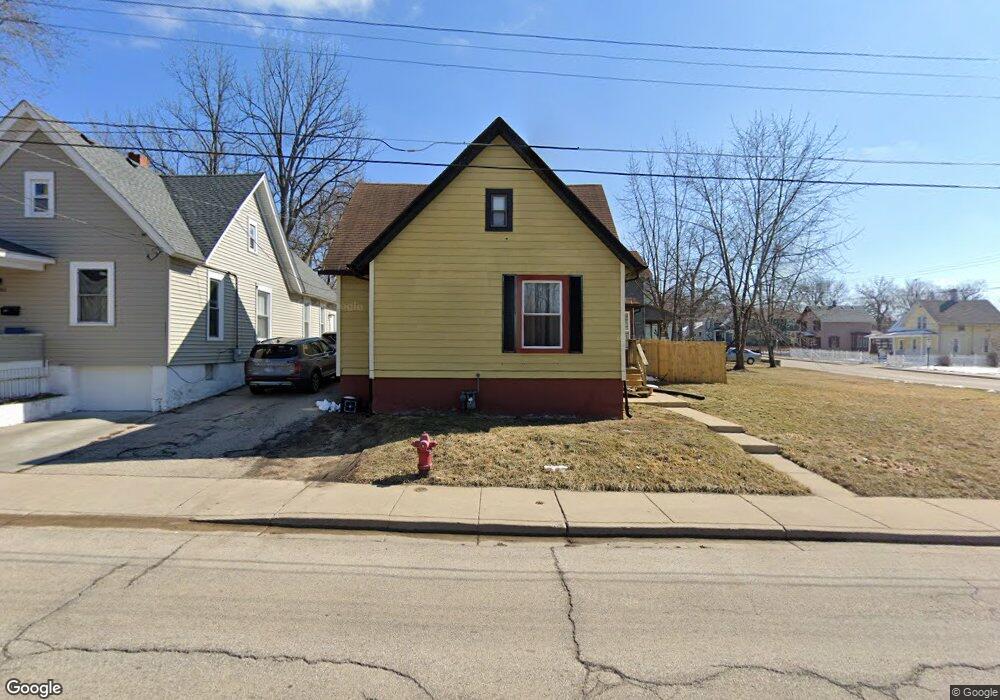
257 N Gifford St Elgin, IL 60120
Northeast Elgin NeighborhoodEstimated Value: $245,553 - $295,000
5
Beds
1
Bath
1,740
Sq Ft
$158/Sq Ft
Est. Value
About This Home
This home is located at 257 N Gifford St, Elgin, IL 60120 and is currently estimated at $274,888, approximately $157 per square foot. 257 N Gifford St is a home located in Kane County with nearby schools including Ronald D O'Neal Elementary School, Larsen Middle School, and Elgin High School.
Ownership History
Date
Name
Owned For
Owner Type
Purchase Details
Closed on
Jul 9, 2021
Sold by
Lee Albert
Bought by
Carrington Lyticia S and Garcia John
Current Estimated Value
Home Financials for this Owner
Home Financials are based on the most recent Mortgage that was taken out on this home.
Original Mortgage
$129,731
Outstanding Balance
$117,711
Interest Rate
2.9%
Mortgage Type
FHA
Estimated Equity
$157,177
Purchase Details
Closed on
Aug 22, 2002
Sold by
Lee Brenda
Bought by
Lee Albert
Home Financials for this Owner
Home Financials are based on the most recent Mortgage that was taken out on this home.
Original Mortgage
$88,800
Interest Rate
6.32%
Purchase Details
Closed on
Aug 11, 1999
Sold by
Carrington Gwendolyn R
Bought by
Lee Albert and Lee Brenda
Home Financials for this Owner
Home Financials are based on the most recent Mortgage that was taken out on this home.
Original Mortgage
$63,900
Interest Rate
8.21%
Create a Home Valuation Report for This Property
The Home Valuation Report is an in-depth analysis detailing your home's value as well as a comparison with similar homes in the area
Home Values in the Area
Average Home Value in this Area
Purchase History
| Date | Buyer | Sale Price | Title Company |
|---|---|---|---|
| Carrington Lyticia S | $150,000 | Stewart Title | |
| Lee Albert | -- | Stewart Title Company | |
| Lee Albert | $71,000 | -- |
Source: Public Records
Mortgage History
| Date | Status | Borrower | Loan Amount |
|---|---|---|---|
| Open | Carrington Lyticia S | $129,731 | |
| Previous Owner | Lee Albert | $88,800 | |
| Previous Owner | Lee Albert | $63,900 |
Source: Public Records
Tax History Compared to Growth
Tax History
| Year | Tax Paid | Tax Assessment Tax Assessment Total Assessment is a certain percentage of the fair market value that is determined by local assessors to be the total taxable value of land and additions on the property. | Land | Improvement |
|---|---|---|---|---|
| 2024 | $5,411 | $67,619 | $10,818 | $56,801 |
| 2023 | $5,207 | $61,088 | $9,773 | $51,315 |
| 2022 | $4,830 | $55,701 | $8,911 | $46,790 |
| 2021 | $4,646 | $52,076 | $8,331 | $43,745 |
| 2020 | $4,353 | $47,725 | $7,953 | $39,772 |
| 2019 | $4,246 | $45,461 | $7,576 | $37,885 |
| 2018 | $3,778 | $38,212 | $7,137 | $31,075 |
| 2017 | $3,716 | $36,124 | $6,747 | $29,377 |
| 2016 | $3,574 | $33,513 | $6,259 | $27,254 |
| 2015 | -- | $30,719 | $5,737 | $24,982 |
| 2014 | -- | $30,340 | $5,666 | $24,674 |
| 2013 | -- | $35,609 | $5,815 | $29,794 |
Source: Public Records
Map
Nearby Homes
- 453 Addison St
- 370 North St
- 419 Fremont St
- 428 Fremont St
- 117 Tennyson Ct
- 144 Hill Ave
- 481 Division St
- 8 Walker Place
- 376 Jefferson Ave
- 409 Algona Ave
- 528 E Chicago St
- 407 N Liberty St
- 602 Prospect St
- 650 Park St
- 216 Prairie St
- 805 Augusta Ave
- 281 Gifford Place
- 277 Gifford Place
- 217 Henry St
- 624 Lincoln Ave
- 261 N Gifford St
- 406 Addison St
- 266 N Gifford St
- 410 Addison St
- 265 N Gifford St
- 252 N Gifford St
- 412 Addison St
- 256 N Gifford St Unit 58
- 405 Addison St
- 230 N Gifford St Unit 232
- 271 N Gifford St
- 230-232 N Gifford St
- 414 Addison St
- 268 N Gifford St
- 225 N Gifford St
- 409 Addison St
- 226 N Gifford St
- 416 Addison St
- 411 Franklin Blvd
- 270 N Gifford St