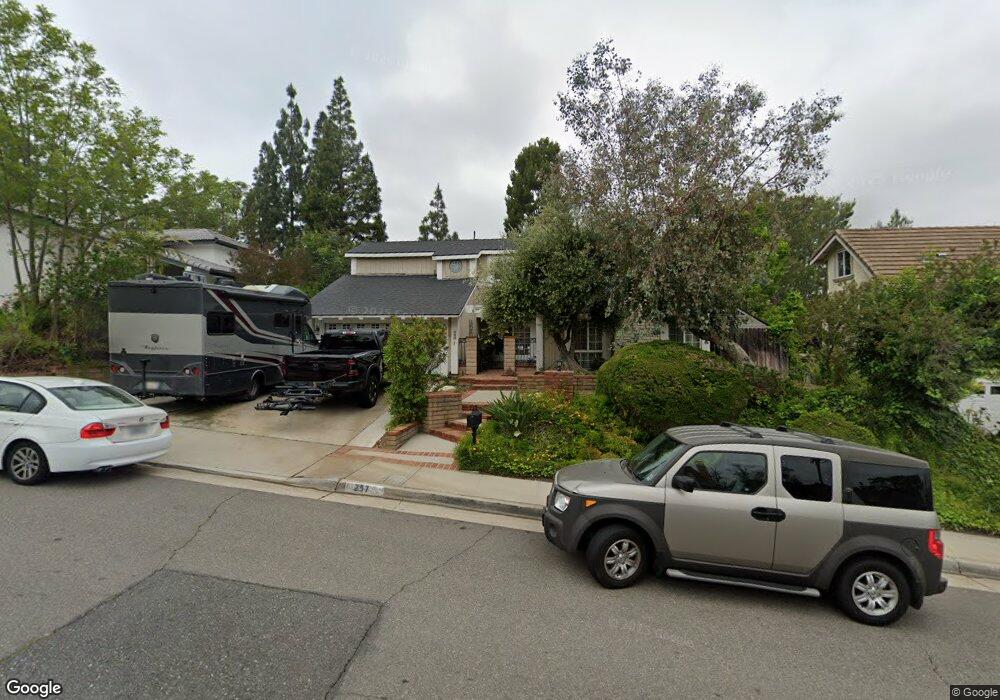
257 S Hillcrest St Anaheim, CA 92807
Anaheim Hills NeighborhoodEstimated Value: $1,280,992 - $1,415,000
5
Beds
3
Baths
2,159
Sq Ft
$631/Sq Ft
Est. Value
About This Home
This home is located at 257 S Hillcrest St, Anaheim, CA 92807 and is currently estimated at $1,361,498, approximately $630 per square foot. 257 S Hillcrest St is a home located in Orange County with nearby schools including Imperial Elementary School, Canyon High School, and El Rancho Charter.
Ownership History
Date
Name
Owned For
Owner Type
Purchase Details
Closed on
Aug 26, 2020
Sold by
Semaan Hanna and Semaan Madeleine
Bought by
Semaan Hanna and Semaan Madeleine
Current Estimated Value
Purchase Details
Closed on
Nov 6, 2002
Sold by
Yu Roginelli
Bought by
Semaan Hanna S and Semaan Madeleine S
Home Financials for this Owner
Home Financials are based on the most recent Mortgage that was taken out on this home.
Original Mortgage
$300,000
Outstanding Balance
$113,881
Interest Rate
4.75%
Mortgage Type
Purchase Money Mortgage
Estimated Equity
$1,247,617
Purchase Details
Closed on
Aug 5, 1998
Sold by
Bank Of America National Trust
Bought by
Yu Roginelli
Home Financials for this Owner
Home Financials are based on the most recent Mortgage that was taken out on this home.
Original Mortgage
$227,600
Interest Rate
6.88%
Purchase Details
Closed on
Apr 9, 1998
Sold by
Harold Daniel E and Harold Janet Sue
Bought by
Bankamerica National Trust Co and Security Pacific National Trust Company
Create a Home Valuation Report for This Property
The Home Valuation Report is an in-depth analysis detailing your home's value as well as a comparison with similar homes in the area
Home Values in the Area
Average Home Value in this Area
Purchase History
| Date | Buyer | Sale Price | Title Company |
|---|---|---|---|
| Semaan Hanna | -- | None Available | |
| Semaan Hanna S | $460,000 | -- | |
| Yu Roginelli | $284,500 | Fidelity National Title Ins | |
| Bankamerica National Trust Co | $313,758 | North American Title Company |
Source: Public Records
Mortgage History
| Date | Status | Borrower | Loan Amount |
|---|---|---|---|
| Open | Semaan Hanna S | $300,000 | |
| Previous Owner | Yu Roginelli | $227,600 | |
| Closed | Yu Roginelli | $56,900 |
Source: Public Records
Tax History Compared to Growth
Tax History
| Year | Tax Paid | Tax Assessment Tax Assessment Total Assessment is a certain percentage of the fair market value that is determined by local assessors to be the total taxable value of land and additions on the property. | Land | Improvement |
|---|---|---|---|---|
| 2025 | $7,297 | $666,226 | $479,766 | $186,460 |
| 2024 | $7,297 | $653,163 | $470,359 | $182,804 |
| 2023 | $7,136 | $640,356 | $461,136 | $179,220 |
| 2022 | $6,998 | $627,800 | $452,094 | $175,706 |
| 2021 | $6,803 | $615,491 | $443,230 | $172,261 |
| 2020 | $6,740 | $609,180 | $438,685 | $170,495 |
| 2019 | $6,655 | $597,236 | $430,084 | $167,152 |
| 2018 | $6,554 | $585,526 | $421,651 | $163,875 |
| 2017 | $6,282 | $574,046 | $413,384 | $160,662 |
| 2016 | $6,161 | $562,791 | $405,279 | $157,512 |
| 2015 | $6,081 | $554,338 | $399,191 | $155,147 |
| 2014 | $5,952 | $543,480 | $391,372 | $152,108 |
Source: Public Records
Map
Nearby Homes
- 397 S San Vicente Ln Unit 31
- 131 S Francisco St
- 5997 E Calle Principia
- 6093 E Brighton Ln
- 5984 E Avenida la Vida
- 562 S Covered Wagon Trail
- 6070 E Summit Ct Unit 48
- 6024 E Silverspur Trail
- 396 Auburn Heights
- 660 S Covered Wagon Trail
- 230 S Plaza de Domingos
- 5548 E Vista Del Este
- 5540 E Vista Del Este
- 6073 E Butterfield Ln
- 480 S Avenida Faro
- 242 N Camino Arroyo
- 581 S Paseo Carmel
- 463 S Westridge Cir
- 595 S Avenida Faro
- 157 S Donna Ct
- 259 S Hillcrest St
- 253 S Hillcrest St
- 282 S Leandro St
- 263 S Hillcrest St
- 284 S Leandro St
- 258 S Hillcrest St
- 260 S Hillcrest St
- 249 S Hillcrest St
- 254 S Hillcrest St
- 288 S Leandro St
- 264 S Hillcrest St
- 280 S Leandro St
- 267 S Hillcrest St
- 6054 E Tiber Dr
- 250 S Hillcrest St
- 292 S Leandro St
- 246 S Hillcrest St
- 6007 E Hillcrest Cir
- 269 S Hillcrest St
- 6040 E Tiber Dr