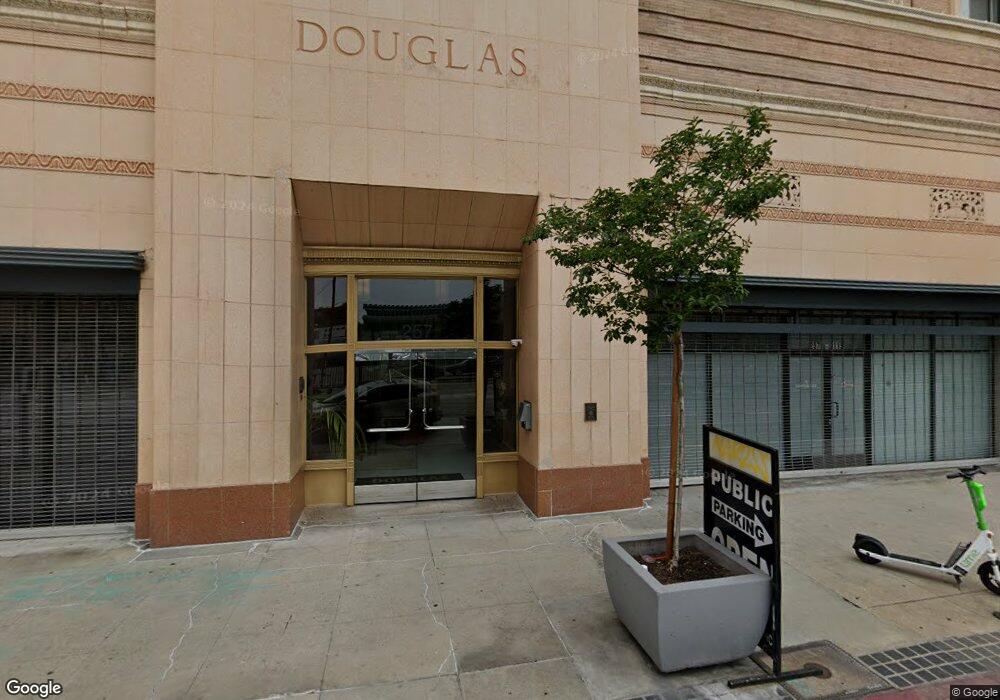
257 S Spring St Unit 3A Los Angeles, CA 90012
Downtown LA NeighborhoodEstimated Value: $371,000 - $508,000
--
Bed
1
Bath
720
Sq Ft
$612/Sq Ft
Est. Value
About This Home
This home is located at 257 S Spring St Unit 3A, Los Angeles, CA 90012 and is currently estimated at $440,826, approximately $612 per square foot. 257 S Spring St Unit 3A is a home located in Los Angeles County with nearby schools including Para Los Niños Charter Middle School, Sal Castro Middle School, and Ramón C. Cortines School of Visual and Performing Arts.
Ownership History
Date
Name
Owned For
Owner Type
Purchase Details
Closed on
Jul 23, 2024
Sold by
Xie Yun
Bought by
Tseng Lisa C
Current Estimated Value
Home Financials for this Owner
Home Financials are based on the most recent Mortgage that was taken out on this home.
Original Mortgage
$386,400
Outstanding Balance
$381,749
Interest Rate
6.95%
Mortgage Type
New Conventional
Estimated Equity
$59,077
Purchase Details
Closed on
Apr 1, 2019
Sold by
The Cooper Family Trust
Bought by
Raymond And Georgia Hamilton Livng Trust
Purchase Details
Closed on
Jul 21, 2015
Sold by
Cooper Ernest C
Bought by
The Cooper Family Trust
Purchase Details
Closed on
May 4, 2005
Sold by
257 Spring Street Llc
Bought by
Cooper Ernest C
Home Financials for this Owner
Home Financials are based on the most recent Mortgage that was taken out on this home.
Original Mortgage
$264,000
Interest Rate
5.5%
Mortgage Type
Fannie Mae Freddie Mac
Create a Home Valuation Report for This Property
The Home Valuation Report is an in-depth analysis detailing your home's value as well as a comparison with similar homes in the area
Home Values in the Area
Average Home Value in this Area
Purchase History
| Date | Buyer | Sale Price | Title Company |
|---|---|---|---|
| Tseng Lisa C | -- | Provident Title | |
| Tseng Lisa C | $483,000 | Provident Title Company | |
| Raymond And Georgia Hamilton Livng Trust | $540,000 | Old Republic Title Company | |
| The Cooper Family Trust | -- | None Available | |
| Cooper Ernest C | $330,000 | First American Title Co |
Source: Public Records
Mortgage History
| Date | Status | Borrower | Loan Amount |
|---|---|---|---|
| Open | Tseng Lisa C | $386,400 | |
| Previous Owner | Cooper Ernest C | $264,000 | |
| Closed | Cooper Ernest C | $49,500 |
Source: Public Records
Tax History Compared to Growth
Tax History
| Year | Tax Paid | Tax Assessment Tax Assessment Total Assessment is a certain percentage of the fair market value that is determined by local assessors to be the total taxable value of land and additions on the property. | Land | Improvement |
|---|---|---|---|---|
| 2025 | $1,816 | $134,000 | $26,800 | $107,200 |
| 2024 | $1,816 | $134,000 | $26,800 | $107,200 |
| 2023 | $1,812 | $134,000 | $26,800 | $107,200 |
| 2022 | $1,762 | $134,000 | $26,800 | $107,200 |
| 2021 | $1,822 | $139,000 | $27,800 | $111,200 |
| 2020 | $2,188 | $167,000 | $33,400 | $133,600 |
| 2019 | $2,148 | $167,000 | $33,400 | $133,600 |
| 2018 | $2,176 | $167,000 | $33,400 | $133,600 |
| 2016 | $2,504 | $196,000 | $58,800 | $137,200 |
| 2015 | $2,214 | $196,000 | $58,800 | $137,200 |
| 2014 | $1,905 | $196,000 | $58,800 | $137,200 |
Source: Public Records
Map
Nearby Homes
- 257 S Spring St Unit 3C
- 253 S Broadway Unit 507
- 108 W 2nd St Unit 803
- 108 W 2nd St Unit 1006
- 108 W 2nd St Unit 701
- 108 W 2nd St Unit 309
- 108 W 2nd St Unit 711
- 108 W 2nd St Unit 215
- 108 W 2nd St Unit 1007
- 108 W 2nd St Unit 708
- 108 W 2nd St Unit 915
- 400 S Broadway Unit 928
- 400 S Broadway Unit 828
- 400 S Broadway Unit 502
- 400 S Broadway Unit 1504
- 400 S Broadway Unit 3106
- 400 S Broadway Unit 2101
- 400 S Broadway Unit 1702
- 400 S Broadway Unit 1012
- 400 S Broadway Unit 1001
- 257 S Spring St Unit PENTM
- 257 S Spring St Unit 3E
- 257 S Spring St Unit 51
- 257 S Spring St Unit PENT
- 257 S Spring St Unit 4M
- 257 S Spring St Unit 2P
- 257 S Spring St Unit 2E
- 257 S Spring St Unit 4H
- 257 S Spring St Unit 4K
- 257 S Spring St Unit PH B
- 257 S Spring St Unit 4A
- 257 S Spring St Unit 2B
- 257 S Spring St Unit 3P
- 257 S Spring St Unit 4P
- 257 S Spring St Unit 2D
- 257 S Spring St Unit 4D
- 257 S Spring St Unit 3N
- 257 S Spring St Unit 4B
- 257 S Spring St Unit 3G
- 257 S Spring St Unit 3F