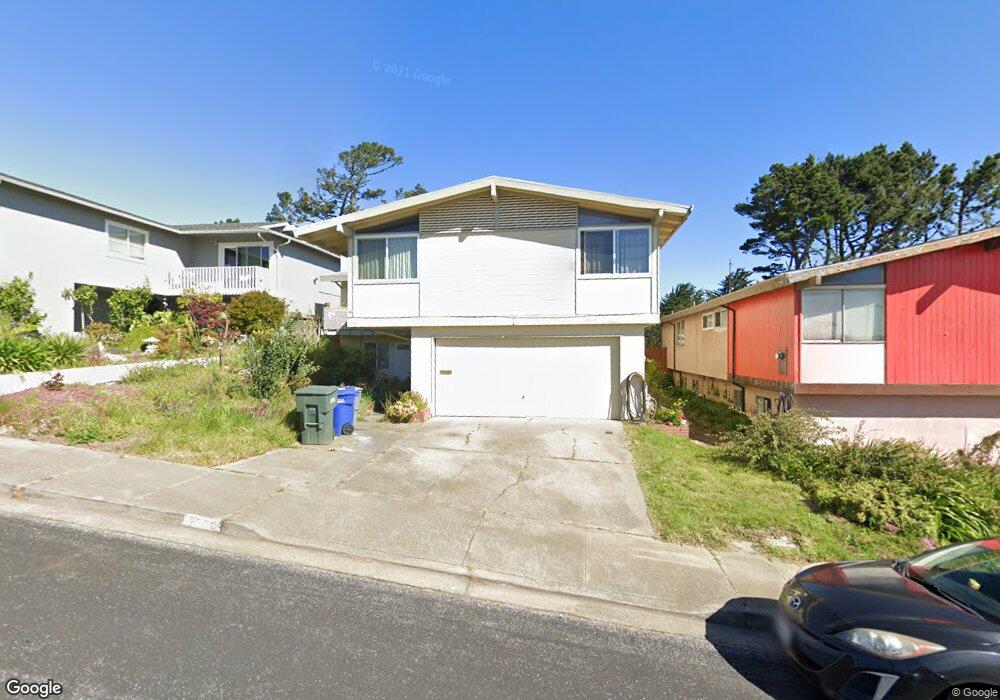
2570 Bantry Ln South San Francisco, CA 94080
Westborough NeighborhoodEstimated Value: $1,188,000 - $1,864,000
3
Beds
3
Baths
2,550
Sq Ft
$624/Sq Ft
Est. Value
About This Home
This home is located at 2570 Bantry Ln, South San Francisco, CA 94080 and is currently estimated at $1,592,184, approximately $624 per square foot. 2570 Bantry Ln is a home located in San Mateo County with nearby schools including Monte Verde Elementary School, Westborough Middle School, and South San Francisco High School.
Ownership History
Date
Name
Owned For
Owner Type
Purchase Details
Closed on
Mar 12, 2023
Sold by
Geronima S Belen-Bautista Living Trust
Bought by
Ggjsb 2 Llc
Current Estimated Value
Purchase Details
Closed on
Dec 14, 2012
Sold by
Belen Bautista Geronima S
Bought by
Belen Bautista Geronima S
Purchase Details
Closed on
Oct 25, 1999
Sold by
Belen Geronima S and Belen Geronima S
Bought by
Belen Bautista Geronima S
Purchase Details
Closed on
Mar 16, 1998
Sold by
Bautista Francisco
Bought by
Belen Geronima S
Home Financials for this Owner
Home Financials are based on the most recent Mortgage that was taken out on this home.
Original Mortgage
$165,000
Interest Rate
7.02%
Create a Home Valuation Report for This Property
The Home Valuation Report is an in-depth analysis detailing your home's value as well as a comparison with similar homes in the area
Home Values in the Area
Average Home Value in this Area
Purchase History
| Date | Buyer | Sale Price | Title Company |
|---|---|---|---|
| Ggjsb 2 Llc | -- | None Listed On Document | |
| Glenn S Belen 2022 Exempt Trust | -- | None Listed On Document | |
| Belen Bautista Geronima S | -- | None Available | |
| Belen Glenn S | -- | None Available | |
| Belen Bautista Geronima S | -- | None Available | |
| Belen Bautista Geronima S | -- | -- | |
| Belen Geronima S | -- | Old Republic Title Ins Compa |
Source: Public Records
Mortgage History
| Date | Status | Borrower | Loan Amount |
|---|---|---|---|
| Previous Owner | Belen Geronima S | $165,000 |
Source: Public Records
Tax History Compared to Growth
Tax History
| Year | Tax Paid | Tax Assessment Tax Assessment Total Assessment is a certain percentage of the fair market value that is determined by local assessors to be the total taxable value of land and additions on the property. | Land | Improvement |
|---|---|---|---|---|
| 2025 | $6,729 | $564,266 | $301,463 | $262,803 |
| 2023 | $6,729 | $377,124 | $162,283 | $214,841 |
| 2022 | $4,593 | $369,731 | $159,102 | $210,629 |
| 2021 | $4,561 | $362,484 | $155,984 | $206,500 |
| 2020 | $4,369 | $358,770 | $154,386 | $204,384 |
| 2019 | $4,265 | $351,736 | $151,359 | $200,377 |
| 2018 | $4,293 | $344,841 | $148,392 | $196,449 |
| 2017 | $4,162 | $338,081 | $145,483 | $192,598 |
| 2016 | $3,873 | $331,455 | $142,632 | $188,823 |
| 2015 | $3,799 | $326,479 | $140,491 | $185,988 |
| 2014 | $1,802 | $138,376 | $32,019 | $106,357 |
Source: Public Records
Map
Nearby Homes
- 2504 Ardee Ln
- 7222 Shannon Park Ct
- 3550 Carter Dr Unit 30
- 3550 Carter Dr Unit 65
- 2410 Bantry Ln
- 3639 Erris Ct
- 2779 Duhallow Way
- 2679 Sean Ct
- 2449 Unwin Ct
- 2316 Kristie Ln
- 3392 Fleetwood Dr
- 2410 Tipperary Ave
- 720 Lockhaven Dr
- 672 Claridge Dr
- 2210 Gellert Blvd Unit 5111
- 3151 Summit Rd
- 3836 Carter Dr
- 1 Appian Way Unit 708-1
- 1 Appian Way Unit 703-2
- 1 Appian Way Unit 715-11
- 2560 Bantry Ln
- 2580 Bantry Ln
- 2550 Bantry Ln
- 2590 Bantry Ln
- 2540 Bantry Ln
- 2595 Bantry Ln
- 2565 Bantry Ln
- 3612 Bantry Ln
- 2637 Bantry Ln
- 2555 Bantry Ln
- 3440 Oakmont Dr
- 2530 Bantry Ln
- 2601 Bantry Ct
- 2673 Bantry Ln
- 2545 Bantry Ln
- 3500 Callan Blvd Unit 201
- 3500 Callan Blvd Unit 100
- 3500 Callan Blvd
- 2613 Bantry Ct
- 3420 Oakmont Dr