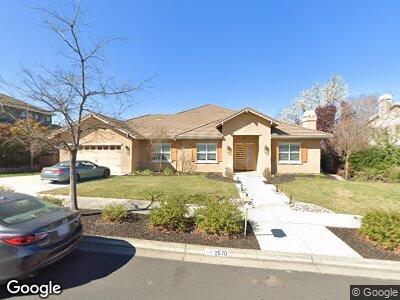
2570 Normandy Cir Livermore, CA 94550
Tapestry NeighborhoodEstimated Value: $2,678,000 - $2,907,056
4
Beds
5
Baths
4,150
Sq Ft
$670/Sq Ft
Est. Value
About This Home
This home is located at 2570 Normandy Cir, Livermore, CA 94550 and is currently estimated at $2,781,014, approximately $670 per square foot. 2570 Normandy Cir is a home located in Alameda County with nearby schools including Granada High School, Our Savior Lutheran, and St Michael's School.
Ownership History
Date
Name
Owned For
Owner Type
Purchase Details
Closed on
Jan 19, 2024
Sold by
Zolkos Family Trust
Bought by
Veuve Aaron and Zolkos Jill
Current Estimated Value
Home Financials for this Owner
Home Financials are based on the most recent Mortgage that was taken out on this home.
Original Mortgage
$309,664
Outstanding Balance
$306,898
Interest Rate
6.69%
Mortgage Type
Credit Line Revolving
Estimated Equity
$2,541,026
Purchase Details
Closed on
May 6, 2015
Sold by
Zolkos Jill
Bought by
Zolkos Jill M and Zolkos Family Trust
Purchase Details
Closed on
Mar 5, 2012
Sold by
Manfred Haggis Llc
Bought by
Zolkos Jill
Purchase Details
Closed on
May 3, 2011
Sold by
Burbach Construction Inc
Bought by
Manfred Haggis Llc
Purchase Details
Closed on
Oct 13, 2010
Sold by
Nigg Danny and Nigg Sherry
Bought by
Burbach Construction Inc
Purchase Details
Closed on
Jul 22, 2010
Sold by
Chin Raymond E
Bought by
Nigg Danny and Nigg Sherry
Create a Home Valuation Report for This Property
The Home Valuation Report is an in-depth analysis detailing your home's value as well as a comparison with similar homes in the area
Home Values in the Area
Average Home Value in this Area
Purchase History
| Date | Buyer | Sale Price | Title Company |
|---|---|---|---|
| Veuve Aaron | -- | Fidelity National Title Compan | |
| Zolkos Jill M | -- | None Available | |
| Zolkos Jill | $1,062,500 | Chicago Title Company | |
| Manfred Haggis Llc | $310,000 | Chicago Title Company | |
| Burbach Construction Inc | $310,000 | Chicago Title Company | |
| Nigg Danny | $300,000 | Chicago Title Company |
Source: Public Records
Mortgage History
| Date | Status | Borrower | Loan Amount |
|---|---|---|---|
| Open | Veuve Aaron | $990,990 |
Source: Public Records
Tax History Compared to Growth
Tax History
| Year | Tax Paid | Tax Assessment Tax Assessment Total Assessment is a certain percentage of the fair market value that is determined by local assessors to be the total taxable value of land and additions on the property. | Land | Improvement |
|---|---|---|---|---|
| 2024 | $19,488 | $1,616,130 | $392,499 | $1,223,631 |
| 2023 | $19,238 | $1,584,447 | $384,804 | $1,199,643 |
| 2022 | $19,001 | $1,553,381 | $377,259 | $1,176,122 |
| 2021 | $17,902 | $1,522,932 | $369,864 | $1,153,068 |
| 2020 | $17,445 | $1,507,325 | $366,074 | $1,141,251 |
| 2019 | $17,569 | $1,477,782 | $358,899 | $1,118,883 |
| 2018 | $17,266 | $1,448,815 | $351,864 | $1,096,951 |
| 2017 | $16,879 | $1,420,414 | $344,967 | $1,075,447 |
| 2016 | $16,337 | $1,392,563 | $338,203 | $1,054,360 |
| 2015 | $15,307 | $1,371,654 | $333,125 | $1,038,529 |
| 2014 | $14,026 | $1,250,668 | $326,600 | $924,068 |
Source: Public Records
Map
Nearby Homes
- 2192 Foscalina Ct
- 2328 Normandy Cir
- 2405 Vintage Ln
- 2726 Louvre Ln
- 1630 Frankfurt Way
- 1597 Genoa St
- 2135 Terra Bella Ct
- 1636 Helsinki Way
- 1290 Vienna St
- 2703 Crater Rd
- 1915 De Vaca Way
- 2193 Autinori Ct
- 1004 Vienna St
- 3043 Picholine Dr
- 2289 Hampton Rd
- 1153 Sherry Way
- 937 Florence Rd
- 1324 Chateau Common Unit 204
- 1769 Old Tower Rd
- 1850 Old Tower Rd