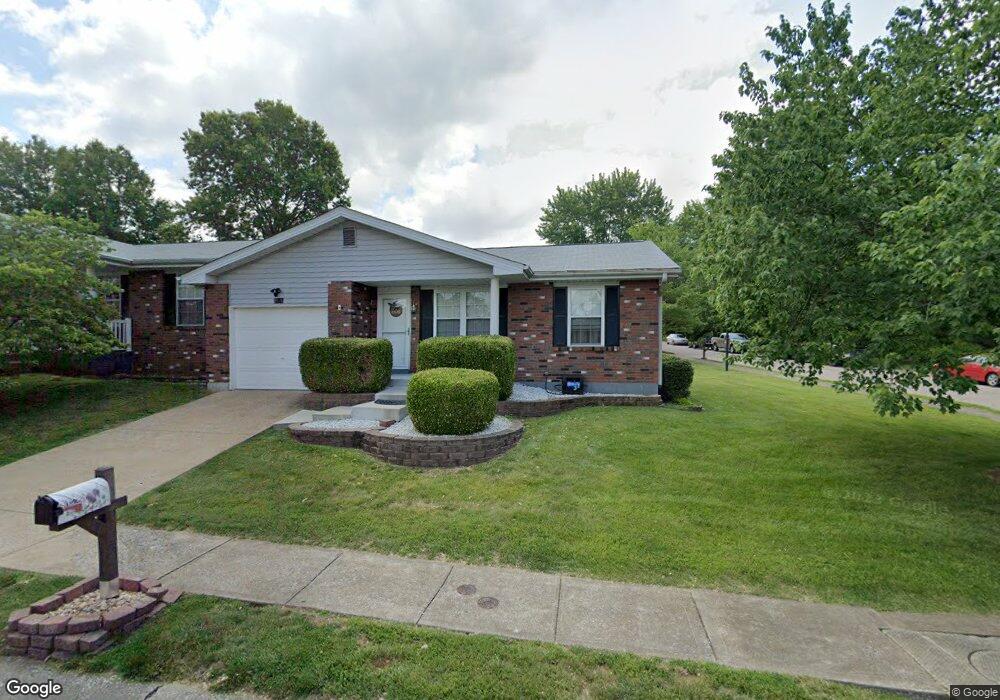
2570 Tanglewood Dr Arnold, MO 63010
Estimated Value: $185,805 - $209,000
2
Beds
2
Baths
688
Sq Ft
$286/Sq Ft
Est. Value
About This Home
This home is located at 2570 Tanglewood Dr, Arnold, MO 63010 and is currently estimated at $196,951, approximately $286 per square foot. 2570 Tanglewood Dr is a home located in Jefferson County with nearby schools including Fox Elementary School, Fox Middle School, and Fox Senior High School.
Ownership History
Date
Name
Owned For
Owner Type
Purchase Details
Closed on
May 27, 2009
Sold by
Long Robert G and Long Beverly A
Bought by
Huber Erika M
Current Estimated Value
Home Financials for this Owner
Home Financials are based on the most recent Mortgage that was taken out on this home.
Original Mortgage
$125,661
Outstanding Balance
$78,838
Interest Rate
4.72%
Mortgage Type
FHA
Estimated Equity
$118,113
Purchase Details
Closed on
Aug 15, 2005
Sold by
Baldwin Velvie Marie
Bought by
Long Bobby Gene and Long Patricia Minette
Purchase Details
Closed on
Apr 24, 2000
Sold by
William Worstenholm and William Louise T
Bought by
Baldwin Velvie Marie
Home Financials for this Owner
Home Financials are based on the most recent Mortgage that was taken out on this home.
Original Mortgage
$60,100
Interest Rate
8.21%
Purchase Details
Closed on
Aug 26, 1997
Sold by
William Worstenholm and William Louise
Bought by
Worstenholm Robert Alan and Worstenholm James Edward
Create a Home Valuation Report for This Property
The Home Valuation Report is an in-depth analysis detailing your home's value as well as a comparison with similar homes in the area
Home Values in the Area
Average Home Value in this Area
Purchase History
| Date | Buyer | Sale Price | Title Company |
|---|---|---|---|
| Huber Erika M | -- | Investors Title Company | |
| Long Bobby Gene | -- | U S Title Guaranty Company | |
| Baldwin Velvie Marie | -- | -- | |
| Worstenholm Robert Alan | -- | -- |
Source: Public Records
Mortgage History
| Date | Status | Borrower | Loan Amount |
|---|---|---|---|
| Open | Huber Erika M | $125,661 | |
| Previous Owner | Baldwin Velvie Marie | $60,100 |
Source: Public Records
Tax History Compared to Growth
Tax History
| Year | Tax Paid | Tax Assessment Tax Assessment Total Assessment is a certain percentage of the fair market value that is determined by local assessors to be the total taxable value of land and additions on the property. | Land | Improvement |
|---|---|---|---|---|
| 2025 | $1,091 | $17,100 | $1,300 | $15,800 |
| 2024 | $1,091 | $15,600 | $1,300 | $14,300 |
| 2023 | $1,091 | $15,600 | $1,300 | $14,300 |
| 2022 | $1,112 | $15,600 | $1,300 | $14,300 |
| 2021 | $1,113 | $15,600 | $1,300 | $14,300 |
| 2020 | $1,037 | $13,800 | $1,000 | $12,800 |
| 2019 | $1,041 | $13,800 | $1,000 | $12,800 |
| 2018 | $1,034 | $13,800 | $1,000 | $12,800 |
| 2017 | $1,050 | $13,800 | $1,000 | $12,800 |
| 2016 | $908 | $12,800 | $1,000 | $11,800 |
| 2015 | $910 | $12,800 | $1,000 | $11,800 |
| 2013 | -- | $12,900 | $1,000 | $11,900 |
Source: Public Records
Map
Nearby Homes
- 672 Berrywine Ln
- 1013 Loretta Dr
- 2348 Roland Dr
- 1125 Foxwood Estates Dr
- 0 Unknown Unit 22001740
- 0 Unknown Unit 22001753
- 0 Unknown Unit 22071117
- 0 Unknown Unit 22001730
- 0 Unknown Unit 22071145
- 0 Unknown Unit 21017758
- 630 Idaho Dr
- 2284 Sunnyridge Dr
- 861 Morningside Ln
- 1319 Tony Dr
- 512 Hannah Way
- 1294 Windcrest Cir
- 1385 Fox Ridge Ct
- 608 Mount Vernon Dr
- 515 Christ Dr
- 1419 Fox Ridge Ct
- 2564 Tanglewood Dr
- 924 Woodridge Dr
- 2560 Tanglewood Dr
- 912 Woodridge Dr
- 926 Woodridge Dr
- 910 Woodridge Dr
- 2556 Tanglewood Dr
- 825 Beechwood Dr
- 911 Woodridge Dr
- 2552 Tanglewood Dr
- 823 Beechwood Dr
- 2553 Tanglewood Dr
- 913 Woodridge Dr
- 896 Barwood Dr
- 2668 Diane Dr
- 2548 Tanglewood Dr
- 803 Beechwood Dr
- 2549 Tanglewood Dr
- 894 Barwood Dr
- 2676 Diane Dr