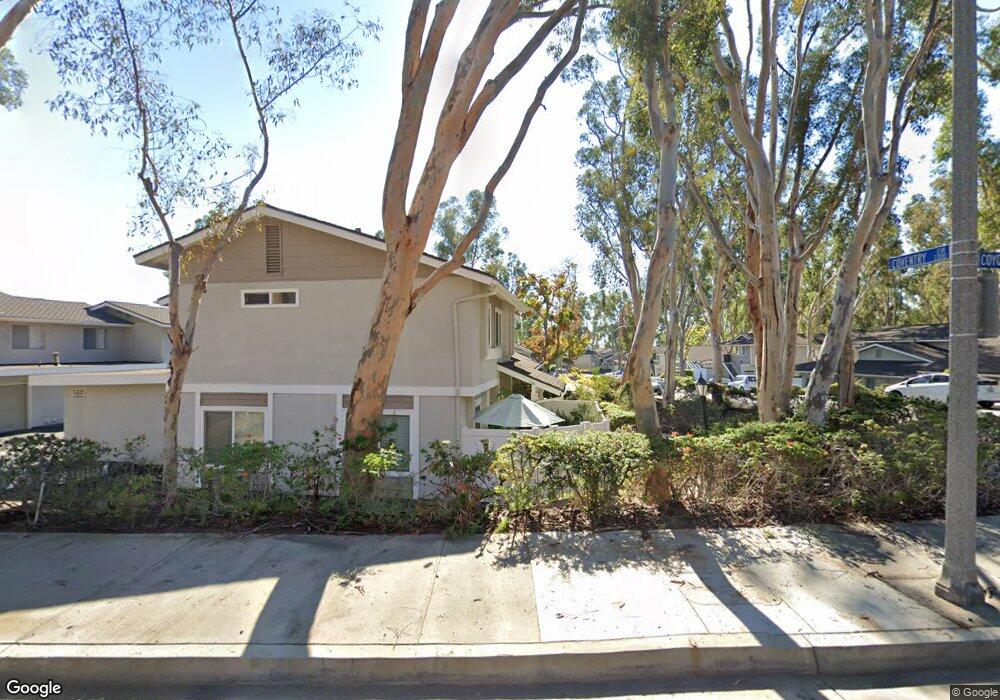
2571 Coventry Cir Unit 106 Fullerton, CA 92833
Sunny Hills NeighborhoodEstimated Value: $577,683 - $655,000
2
Beds
1
Bath
888
Sq Ft
$707/Sq Ft
Est. Value
About This Home
This home is located at 2571 Coventry Cir Unit 106, Fullerton, CA 92833 and is currently estimated at $628,171, approximately $707 per square foot. 2571 Coventry Cir Unit 106 is a home located in Orange County with nearby schools including Sunset Lane Elementary School, D. Russell Parks Junior High School, and Sonora High School.
Ownership History
Date
Name
Owned For
Owner Type
Purchase Details
Closed on
Jun 30, 2003
Sold by
Cronin Russell and Cronin Patricia
Bought by
Graham Sandra Lee
Current Estimated Value
Home Financials for this Owner
Home Financials are based on the most recent Mortgage that was taken out on this home.
Original Mortgage
$204,800
Outstanding Balance
$86,546
Interest Rate
5.18%
Mortgage Type
Purchase Money Mortgage
Estimated Equity
$541,625
Purchase Details
Closed on
Sep 30, 1996
Sold by
Ben Paris and Ben Julie A
Bought by
Cronin Russell and Cronin Patricia
Home Financials for this Owner
Home Financials are based on the most recent Mortgage that was taken out on this home.
Original Mortgage
$93,800
Interest Rate
8.3%
Mortgage Type
FHA
Create a Home Valuation Report for This Property
The Home Valuation Report is an in-depth analysis detailing your home's value as well as a comparison with similar homes in the area
Home Values in the Area
Average Home Value in this Area
Purchase History
| Date | Buyer | Sale Price | Title Company |
|---|---|---|---|
| Graham Sandra Lee | $256,000 | Orange Coast Title | |
| Cronin Russell | $96,500 | California Counties Title Co |
Source: Public Records
Mortgage History
| Date | Status | Borrower | Loan Amount |
|---|---|---|---|
| Open | Graham Sandra Lee | $204,800 | |
| Previous Owner | Cronin Russell | $93,800 | |
| Closed | Graham Sandra Lee | $38,400 |
Source: Public Records
Tax History Compared to Growth
Tax History
| Year | Tax Paid | Tax Assessment Tax Assessment Total Assessment is a certain percentage of the fair market value that is determined by local assessors to be the total taxable value of land and additions on the property. | Land | Improvement |
|---|---|---|---|---|
| 2025 | $4,194 | $363,968 | $265,061 | $98,907 |
| 2024 | $4,194 | $356,832 | $259,864 | $96,968 |
| 2023 | $4,091 | $349,836 | $254,769 | $95,067 |
| 2022 | $4,061 | $342,977 | $249,774 | $93,203 |
| 2021 | $3,992 | $336,252 | $244,876 | $91,376 |
| 2020 | $3,969 | $332,805 | $242,365 | $90,440 |
| 2019 | $3,870 | $326,280 | $237,613 | $88,667 |
| 2018 | $3,812 | $319,883 | $232,954 | $86,929 |
| 2017 | $3,750 | $313,611 | $228,386 | $85,225 |
| 2016 | $3,673 | $307,462 | $223,908 | $83,554 |
| 2015 | $3,573 | $302,844 | $220,545 | $82,299 |
| 2014 | $3,282 | $279,000 | $202,372 | $76,628 |
Source: Public Records
Map
Nearby Homes
- 2303 Coventry Cir Unit 145
- 2300 Coventry Cir Unit 2
- 2320 Coventry Cir
- 2422 Coventry Cir Unit 47
- 2501 Tiffany Place
- 2868 Muir Trail Dr
- 2161 S Ferrier Ct
- 1760 Chantilly Ln
- 2886 Muir Trail Dr
- 1615 Via Linda Unit 16
- 1655 Valley Ln
- 2132 Calavera Place
- 502 S Andrew Ln
- 14055 Santa Barbara St
- 1961 W Snead St
- 2517 Greenhill Dr
- 2116 Camino Centroloma
- 2198 Flame Flower Ln
- 1716 Celeste Ln
- 16405 Visions Dr
- 2573 Coventry Cir Unit 105
- 2573 Coventry Cir
- 2575 Coventry Cir Unit 107
- 2585 Coventry Cir Unit 101
- 2585 Coventry Cir
- 2587 Coventry Cir Unit 102
- 2587 Coventry Cir
- 2577 Coventry Cir Unit 108
- 2583 Coventry Cir Unit 103
- 2583 Coventry Cir
- 2567 Coventry Cir Unit 112
- 2567 Coventry Cir
- 2565 Coventry Cir
- 2581 Coventry Cir Unit 104
- 2563 Coventry Cir Unit 109
- 2561 Coventry Cir Unit 110
- 2315 Coventry Cir Unit 149
- 2315 Coventry Cir
- 2317 Coventry Cir Unit 185
- 2317 Coventry Cir Unit 150