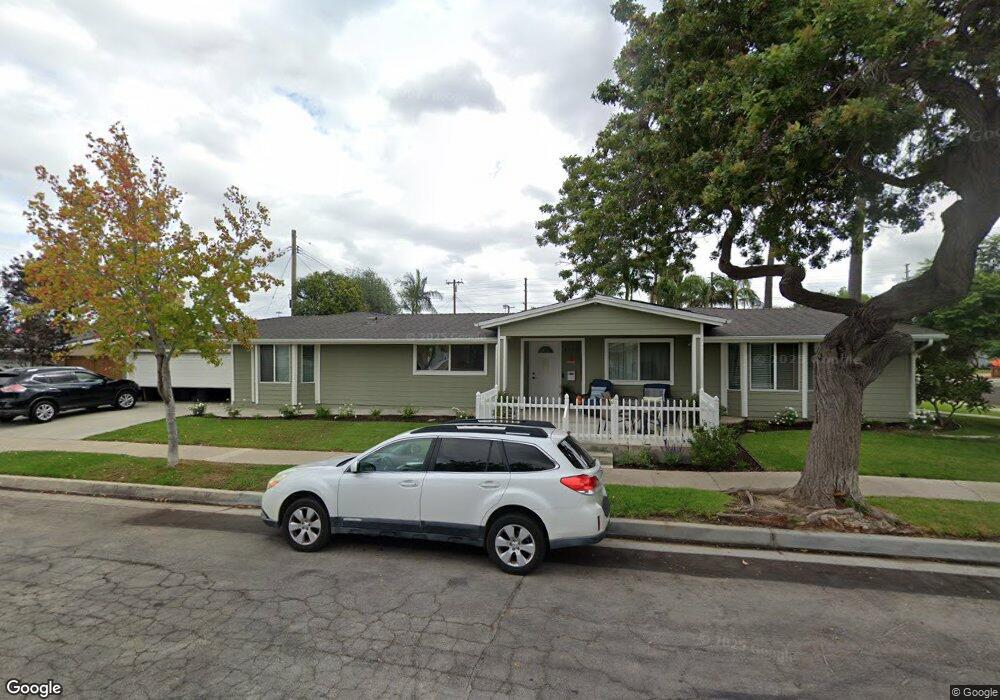
2572 Columbia Dr Costa Mesa, CA 92626
Estimated Value: $1,720,000 - $1,905,000
3
Beds
7
Baths
2,739
Sq Ft
$670/Sq Ft
Est. Value
About This Home
This home is located at 2572 Columbia Dr, Costa Mesa, CA 92626 and is currently estimated at $1,834,249, approximately $669 per square foot. 2572 Columbia Dr is a home located in Orange County with nearby schools including College Park Elementary School, Costa Mesa High School, and Montessori Christian School.
Ownership History
Date
Name
Owned For
Owner Type
Purchase Details
Closed on
Nov 23, 2020
Sold by
2572 Columbia Drive Llc
Bought by
2572 Columbia Drive Llc
Current Estimated Value
Purchase Details
Closed on
Jan 16, 2019
Sold by
Beach Daniel E and Beach Patricia J
Bought by
2575 Columbia Drive Llc
Purchase Details
Closed on
Mar 25, 2004
Sold by
Hoskinson Anne
Bought by
Beach Daniel E and Beach Patricia J
Home Financials for this Owner
Home Financials are based on the most recent Mortgage that was taken out on this home.
Original Mortgage
$395,000
Interest Rate
5.35%
Mortgage Type
Purchase Money Mortgage
Purchase Details
Closed on
Dec 20, 2001
Sold by
Hoskinson Anne
Bought by
Hoskinson Anne and Anne Hoskinson Trust
Create a Home Valuation Report for This Property
The Home Valuation Report is an in-depth analysis detailing your home's value as well as a comparison with similar homes in the area
Purchase History
| Date | Buyer | Sale Price | Title Company |
|---|---|---|---|
| 2572 Columbia Drive Llc | -- | Wilkes Robert L | |
| 2575 Columbia Drive Llc | -- | None Available | |
| Beach Daniel E | $550,000 | Security Union Title | |
| Hoskinson Anne | -- | -- |
Source: Public Records
Mortgage History
| Date | Status | Borrower | Loan Amount |
|---|---|---|---|
| Previous Owner | Beach Daniel E | $395,000 |
Source: Public Records
Tax History
| Year | Tax Paid | Tax Assessment Tax Assessment Total Assessment is a certain percentage of the fair market value that is determined by local assessors to be the total taxable value of land and additions on the property. | Land | Improvement |
|---|---|---|---|---|
| 2025 | $11,259 | $968,442 | $688,898 | $279,544 |
| 2024 | $11,259 | $949,453 | $675,390 | $274,063 |
| 2023 | $10,873 | $930,837 | $662,147 | $268,690 |
| 2022 | $10,465 | $912,586 | $649,164 | $263,422 |
| 2021 | $10,126 | $894,693 | $636,436 | $258,257 |
| 2020 | $10,015 | $885,520 | $629,911 | $255,609 |
| 2019 | $9,803 | $868,157 | $617,559 | $250,598 |
| 2018 | $9,607 | $851,135 | $605,450 | $245,685 |
| 2017 | $9,443 | $834,447 | $593,579 | $240,868 |
| 2016 | $9,239 | $818,086 | $581,940 | $236,146 |
| 2015 | $9,151 | $805,798 | $573,199 | $232,599 |
| 2014 | $8,942 | $790,014 | $561,971 | $228,043 |
Source: Public Records
Map
Nearby Homes
- 2563 Columbia Dr
- 250 Bucknell Rd
- 326 Princeton Dr
- 2404 Niagara Way
- 135 Morristown Ln
- 115 Morristown Ln
- 2408 Saratoga Way
- 157 Yorktown Ln
- 2408 Minuteman Way
- 107 Yorktown Ln
- 2338 Bunker Hill Way
- 106 Lexington Ln
- 403 Aura Dr
- 2333 Rutgers Dr
- 2330 Vanguard Way Unit F102
- 2330 Vanguard Way Unit L101
- 2273 Columbia Dr
- 2279 Rutgers Dr
- 2723 Cibola Ave
- 320 W Wilson St Unit 23
- 222 Wellesley Ln
- 229 Hanover Dr
- 218 Wellesley Ln
- 223 Hanover Dr
- 2571 Columbia Dr
- 2575 Columbia Dr
- 2567 Columbia Dr
- 229 Wellesley Ln
- 219 Hanover Dr
- 223 Wellesley Ln
- 241 Hanover Dr
- 212 Wellesley Ln
- 219 Wellesley Ln
- 213 Hanover Dr
- 245 Hanover Dr
- 2557 Columbia Dr
- 2568 Yale Place
- 208 Wellesley Ln
- 213 Wellesley Ln
- 246 Bowling Green Dr
Your Personal Tour Guide
Ask me questions while you tour the home.