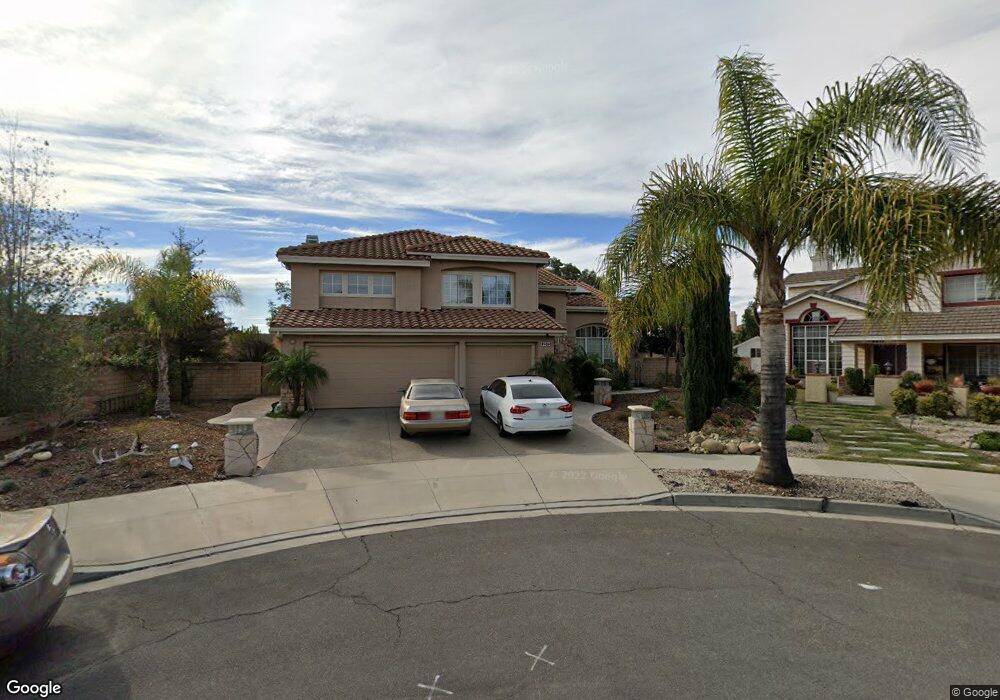
2573 Joshua Ct Oxnard, CA 93036
South Bank NeighborhoodEstimated Value: $921,000 - $1,192,000
3
Beds
3
Baths
2,333
Sq Ft
$458/Sq Ft
Est. Value
About This Home
This home is located at 2573 Joshua Ct, Oxnard, CA 93036 and is currently estimated at $1,068,401, approximately $457 per square foot. 2573 Joshua Ct is a home located in Ventura County with nearby schools including Rio Del Norte Elementary School, Rio Vista Middle School, and Rio Mesa High School.
Ownership History
Date
Name
Owned For
Owner Type
Purchase Details
Closed on
Dec 30, 1998
Sold by
Graves Michael H and Graves Gina M
Bought by
Chackel James and Chackel Tawny
Current Estimated Value
Home Financials for this Owner
Home Financials are based on the most recent Mortgage that was taken out on this home.
Original Mortgage
$238,400
Interest Rate
6.29%
Mortgage Type
Balloon
Purchase Details
Closed on
Jul 22, 1997
Sold by
Graves Michael H and Graves Gina M
Bought by
Graves Michael H and Graves Gina M
Create a Home Valuation Report for This Property
The Home Valuation Report is an in-depth analysis detailing your home's value as well as a comparison with similar homes in the area
Home Values in the Area
Average Home Value in this Area
Purchase History
| Date | Buyer | Sale Price | Title Company |
|---|---|---|---|
| Chackel James | $298,000 | Lawyers Title Company | |
| Graves Michael H | -- | -- |
Source: Public Records
Mortgage History
| Date | Status | Borrower | Loan Amount |
|---|---|---|---|
| Closed | Chackel James | $238,400 | |
| Closed | Chackel James | $59,600 |
Source: Public Records
Tax History
| Year | Tax Paid | Tax Assessment Tax Assessment Total Assessment is a certain percentage of the fair market value that is determined by local assessors to be the total taxable value of land and additions on the property. | Land | Improvement |
|---|---|---|---|---|
| 2025 | $5,522 | $467,147 | $186,857 | $280,290 |
| 2024 | $5,522 | $457,988 | $183,193 | $274,795 |
| 2023 | $5,285 | $449,008 | $179,601 | $269,407 |
| 2022 | $5,133 | $440,204 | $176,079 | $264,125 |
| 2021 | $5,242 | $431,573 | $172,626 | $258,947 |
| 2020 | $5,350 | $427,150 | $170,857 | $256,293 |
| 2019 | $5,136 | $418,775 | $167,507 | $251,268 |
| 2018 | $4,966 | $410,565 | $164,223 | $246,342 |
| 2017 | $4,835 | $402,515 | $161,003 | $241,512 |
| 2016 | $4,584 | $394,624 | $157,847 | $236,777 |
| 2015 | $4,704 | $388,698 | $155,477 | $233,221 |
| 2014 | $4,504 | $381,086 | $152,433 | $228,653 |
Source: Public Records
Map
Nearby Homes
- 2716 Windcrest Ct
- 2485 Elderberry Dr Unit 43
- 2870 Wagon Wheel Rd Unit 203
- 2820 Wagon Wheel Rd Unit 302
- 2820 Wagon Wheel Rd Unit 403
- 2800 Wagon Wheel Rd Unit 304
- 2810 Wagon Wheel Rd Unit 304
- 905 Kumquat Place
- 1340 Kumquat Place
- 2455 Blueberry Dr Unit 120
- 2475 Apple Ln Unit 129
- 901 Indigo Place
- 643 Holly Ave
- 2408 Apple Ln Unit 154
- 550 Holly Ave
- 1361 Gardenia St
- 2225 Edelweiss St Unit 43
- 2151 Olga St
- 2715 Smokey Mountain Dr
- 2100 Norma St
- 2583 Joshua Ct
- 2628 Kentia St
- 2618 Kentia St
- 2563 Joshua Ct
- 2638 Kentia St
- 2706 Yearling Place
- 2584 Joshua Ct
- 2716 Yearling Place
- 2608 Kentia St
- 2648 Kentia St
- 2726 Yearling Place
- 2574 Joshua Ct
- 2600 Kentia St
- 2564 Joshua Ct
- 2736 Yearling Place
- 2543 Joshua Ct
- 2627 Kentia St
- 2554 Joshua Ct
- 2637 Kentia St
- 2617 Kentia St
Your Personal Tour Guide
Ask me questions while you tour the home.