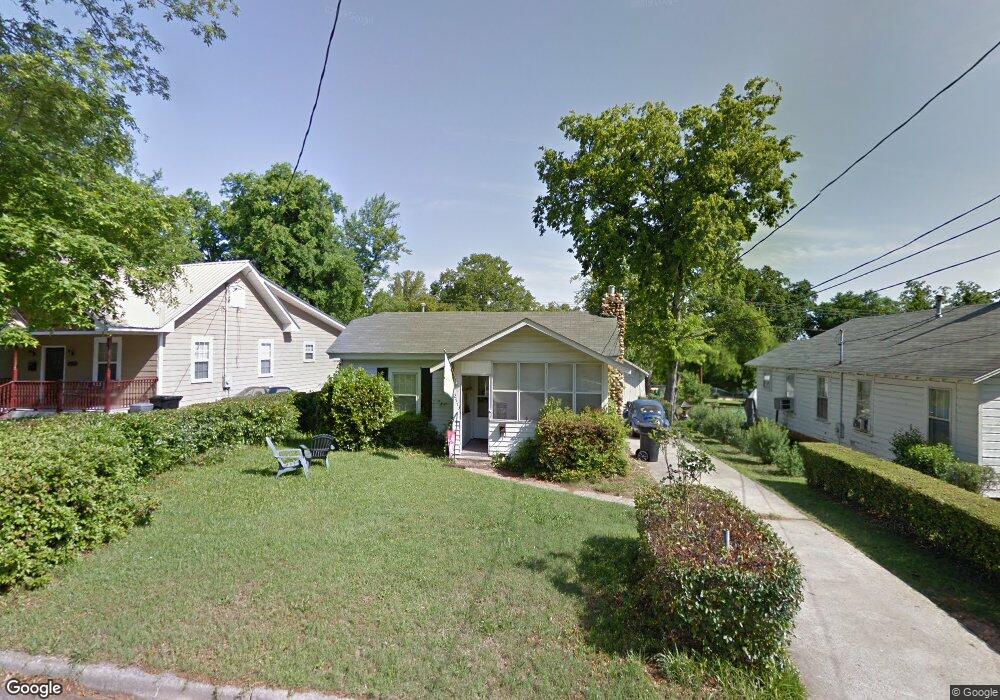
2573 N View Ave Augusta, GA 30904
Sand Hills NeighborhoodEstimated Value: $122,528 - $141,000
2
Beds
1
Bath
980
Sq Ft
$135/Sq Ft
Est. Value
About This Home
This home is located at 2573 N View Ave, Augusta, GA 30904 and is currently estimated at $132,632, approximately $135 per square foot. 2573 N View Ave is a home located in Richmond County with nearby schools including Tutt Middle School, Johnson Magnet, and Westside High School.
Ownership History
Date
Name
Owned For
Owner Type
Purchase Details
Closed on
Oct 31, 2017
Sold by
Maks Stephen M
Bought by
The Glasker Grp Llc
Current Estimated Value
Purchase Details
Closed on
Feb 8, 2000
Sold by
Rofs King Marian E Rofs and Munn Lillian
Bought by
Maks Stephen M
Home Financials for this Owner
Home Financials are based on the most recent Mortgage that was taken out on this home.
Original Mortgage
$39,600
Interest Rate
8.21%
Mortgage Type
Balloon
Purchase Details
Closed on
Dec 18, 1996
Sold by
King John E Rofs King Marian E Rofs
Bought by
King Marian E
Purchase Details
Closed on
Oct 3, 1996
Sold by
King Marian E
Bought by
King Marian E Munn Lillian K King J
Purchase Details
Closed on
Oct 2, 1996
Sold by
King Marian E
Bought by
King Marian E
Purchase Details
Closed on
Jul 13, 1992
Sold by
King John E
Bought by
King John E King Marian E
Purchase Details
Closed on
Jul 10, 1992
Sold by
King John E
Bought by
King John E
Create a Home Valuation Report for This Property
The Home Valuation Report is an in-depth analysis detailing your home's value as well as a comparison with similar homes in the area
Home Values in the Area
Average Home Value in this Area
Purchase History
| Date | Buyer | Sale Price | Title Company |
|---|---|---|---|
| The Glasker Grp Llc | $36,000 | -- | |
| Maks Stephen M | $32,000 | -- | |
| King Marian E | -- | -- | |
| King Marian E Munn Lillian K King J | -- | -- | |
| King Marian E | -- | -- | |
| King John E King Marian E | -- | -- | |
| King John E | -- | -- |
Source: Public Records
Mortgage History
| Date | Status | Borrower | Loan Amount |
|---|---|---|---|
| Previous Owner | Maks Stephen M | $39,600 |
Source: Public Records
Tax History
| Year | Tax Paid | Tax Assessment Tax Assessment Total Assessment is a certain percentage of the fair market value that is determined by local assessors to be the total taxable value of land and additions on the property. | Land | Improvement |
|---|---|---|---|---|
| 2025 | $1,569 | $40,972 | $3,640 | $37,332 |
| 2024 | $1,569 | $29,280 | $3,640 | $25,640 |
| 2023 | $1,165 | $31,252 | $3,640 | $27,612 |
| 2022 | $1,230 | $30,062 | $3,640 | $26,422 |
| 2021 | $1,018 | $19,019 | $3,640 | $15,379 |
| 2020 | $940 | $19,043 | $3,640 | $15,403 |
| 2019 | $985 | $19,043 | $3,640 | $15,403 |
| 2018 | $825 | $19,043 | $3,640 | $15,403 |
| 2017 | $987 | $19,043 | $3,640 | $15,403 |
| 2016 | $987 | $19,043 | $3,640 | $15,403 |
| 2015 | $1,017 | $18,347 | $3,640 | $14,707 |
| 2014 | $986 | $18,850 | $3,640 | $15,210 |
Source: Public Records
Map
Nearby Homes
- 2551 Mount Auburn St
- 2525 N View Ave
- 801 Monte Sano Ave Unit B1
- 801 Monte Sano Ave Unit C4
- 2533 Wheeler Rd
- 2541 Wheeler Rd
- 2522 Porter St
- 1015 Monte Sano Ave
- 2502 Porter St
- 532 Fleming Ave
- 2450 Wheeler Rd
- 526 Fleming Ave
- 2602 Walton Way
- 710 Weed St
- 708 Weed St
- 2440 Earl St
- 616 Weed St
- 2716 Hazel St
- 1231 Glenn Ave
- 1323 Glenn Ave
- 2569 N View Ave
- 2575 N View Ave
- 2567 N View Ave
- 804 Monte Sano Ave
- 2565 N View Ave
- 802 Monte Sano Ave
- 806 Monte Sano Ave
- 2560 Mount Auburn St
- 808 Monte Sano Ave Unit E-3
- 2558 Mount Auburn St
- 2570 N View Ave
- 2563 Mount Auburn St
- 2563 N View Ave
- 2556 Mount Auburn St
- 902 Monte Sano Ave
- 724 Monte Sano Ave
- 2571 Mount Auburn St
- 2568 N View Ave
- 2549 N View Ave
- 2554 Mount Auburn St
Your Personal Tour Guide
Ask me questions while you tour the home.