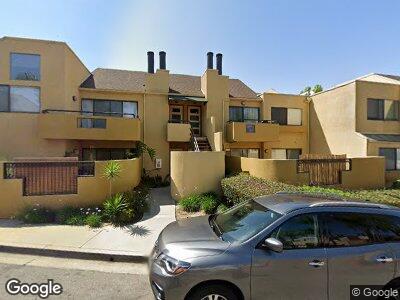
25761 Le Parc Unit 63 Lake Forest, CA 92630
Estimated Value: $456,975 - $488,000
1
Bed
1
Bath
733
Sq Ft
$644/Sq Ft
Est. Value
About This Home
This home is located at 25761 Le Parc Unit 63, Lake Forest, CA 92630 and is currently estimated at $471,744, approximately $643 per square foot. 25761 Le Parc Unit 63 is a home located in Orange County with nearby schools including La Madera Elementary School, Serrano Intermediate School, and El Toro High School.
Ownership History
Date
Name
Owned For
Owner Type
Purchase Details
Closed on
Mar 31, 2023
Sold by
Craig Steven W
Bought by
Craig Steven W and Mosley Amy
Current Estimated Value
Purchase Details
Closed on
Aug 6, 2013
Sold by
Craig Steven M
Bought by
Craig Steven W
Home Financials for this Owner
Home Financials are based on the most recent Mortgage that was taken out on this home.
Original Mortgage
$153,550
Interest Rate
4.33%
Mortgage Type
New Conventional
Purchase Details
Closed on
Oct 26, 2001
Sold by
Craig Steven W
Bought by
Craig Steven W
Home Financials for this Owner
Home Financials are based on the most recent Mortgage that was taken out on this home.
Original Mortgage
$96,000
Interest Rate
6.84%
Purchase Details
Closed on
Apr 11, 2000
Sold by
Jesus Bocanegra Joel and Jesus Liza Maria
Bought by
Craig Steven W
Create a Home Valuation Report for This Property
The Home Valuation Report is an in-depth analysis detailing your home's value as well as a comparison with similar homes in the area
Home Values in the Area
Average Home Value in this Area
Purchase History
| Date | Buyer | Sale Price | Title Company |
|---|---|---|---|
| Craig Steven W | -- | None Listed On Document | |
| Craig Steven W | -- | Servicelink | |
| Craig Steven W | -- | Fidelity National Title Ins | |
| Craig Steven W | -- | -- |
Source: Public Records
Mortgage History
| Date | Status | Borrower | Loan Amount |
|---|---|---|---|
| Previous Owner | Craig Steven W | $153,550 | |
| Previous Owner | Craig Steven W | $162,000 | |
| Previous Owner | Craig Steven W | $155,000 | |
| Previous Owner | Craig Steven W | $143,000 | |
| Previous Owner | Craig Steven W | $128,000 | |
| Previous Owner | Craig Steven W | $96,000 | |
| Closed | Craig Steven W | $19,200 |
Source: Public Records
Tax History Compared to Growth
Tax History
| Year | Tax Paid | Tax Assessment Tax Assessment Total Assessment is a certain percentage of the fair market value that is determined by local assessors to be the total taxable value of land and additions on the property. | Land | Improvement |
|---|---|---|---|---|
| 2024 | $1,487 | $141,630 | $52,406 | $89,224 |
| 2023 | $1,452 | $138,853 | $51,378 | $87,475 |
| 2022 | $1,426 | $136,131 | $50,371 | $85,760 |
| 2021 | $1,398 | $133,462 | $49,383 | $84,079 |
| 2020 | $1,385 | $132,094 | $48,877 | $83,217 |
| 2019 | $1,358 | $129,504 | $47,918 | $81,586 |
| 2018 | $1,333 | $126,965 | $46,978 | $79,987 |
| 2017 | $1,306 | $124,476 | $46,057 | $78,419 |
| 2016 | $1,285 | $122,036 | $45,154 | $76,882 |
| 2015 | $1,269 | $120,203 | $44,475 | $75,728 |
| 2014 | $1,242 | $117,849 | $43,604 | $74,245 |
Source: Public Records
Map
Nearby Homes
- 25761 Le Parc Unit 77
- 25712 Le Parc Unit 96
- 25712 Le Parc Unit 21
- 25712 Le Parc Unit 57
- 25671 Le Parc Unit 93
- 21981 Rimhurst Dr Unit 154
- 22272 Redwood Pointe Unit 5C
- 25598 Mont Pointe Unit 4E
- 25614 Mont Pointe Unit 3D
- 25912 Densmore Dr
- 25885 Trabuco Rd Unit 14
- 25885 Trabuco Rd Unit 305
- 25885 Trabuco Rd Unit 226
- 25885 Trabuco Rd Unit 167
- 25885 Trabuco Rd Unit 271
- 25422 Shoshone Dr
- 21848 Ute Way
- 25801 Chapel Hill Dr
- 26368 Spring Creek Cir Unit 52
- 22435 Silver Spur
- 25761 Le Parc
- 25761 Le Parc Unit 9
- 25761 Le Parc Unit 72
- 25761 Le Parc Unit 63
- 25761 Le Parc Unit 47
- 25761 Le Parc Unit 95
- 25761 Le Parc Unit 87
- 25761 Le Parc Unit 67
- 25761 Le Parc
- 25761 Le Parc Unit 93
- 25761 Le Parc Unit 28
- 25761 Le Parc Unit 39
- 25761 Le Parc Unit 22
- 25761 Le Parc Unit 36
- 25761 Le Parc Unit 31
- 25761 Le Parc Unit 58
- 25761 Le Parc Unit 59
- 25761 Le Parc Unit 4
- 25761 Le Parc Unit 14
- 25761 Le Parc Unit 79