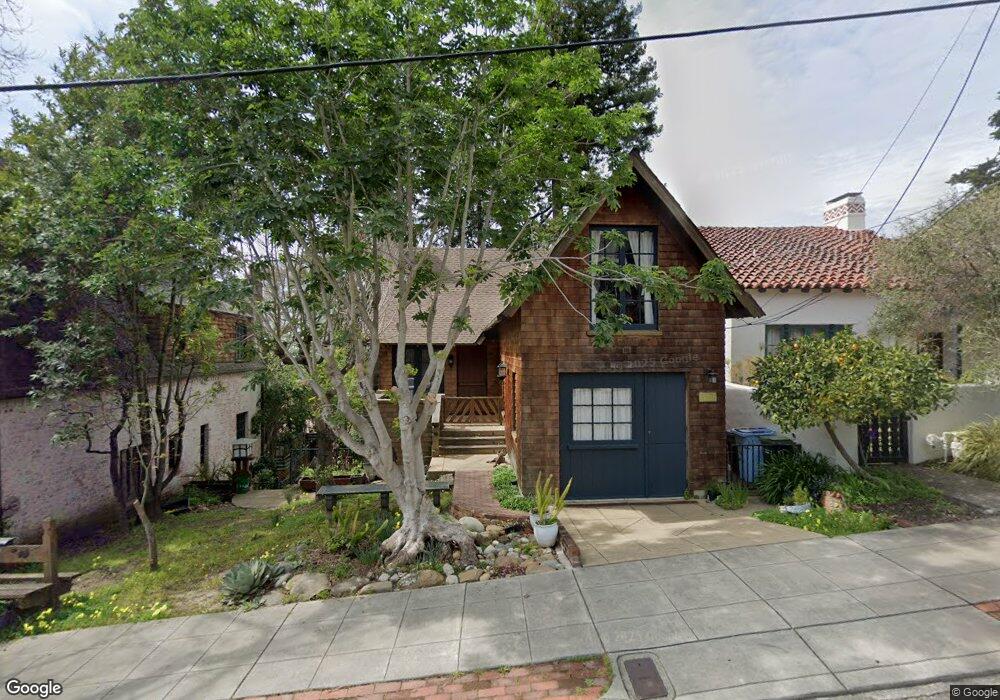
2577 Buena Vista Way Berkeley, CA 94708
Berkeley Hills NeighborhoodEstimated Value: $1,692,000 - $2,309,000
4
Beds
3
Baths
2,909
Sq Ft
$672/Sq Ft
Est. Value
About This Home
This home is located at 2577 Buena Vista Way, Berkeley, CA 94708 and is currently estimated at $1,954,391, approximately $671 per square foot. 2577 Buena Vista Way is a home located in Alameda County with nearby schools including Berkeley Arts Magnet at Whittier School, Cragmont Elementary School, and Washington Elementary School.
Ownership History
Date
Name
Owned For
Owner Type
Purchase Details
Closed on
Oct 4, 2021
Sold by
Johnson Alfred David
Bought by
Johnson Alfred David and Menchara Leticia Beatriz
Current Estimated Value
Purchase Details
Closed on
Jun 22, 2021
Sold by
Johnson Barbara L and Johnson David A
Bought by
Johnson Alfred David
Purchase Details
Closed on
Feb 5, 2021
Sold by
Johnson Barbara
Bought by
The Alfred David Johnson Living Trust
Purchase Details
Closed on
Sep 20, 2020
Sold by
Johnson Alfred David
Bought by
Alfred David Johnson Living Trust and Johnson
Purchase Details
Closed on
Sep 4, 2007
Sold by
Polk Christopher and The Victoria Polk 2004 Trust
Bought by
Johnson A David and Johnson Barbara L
Purchase Details
Closed on
Nov 17, 2004
Sold by
Polk Victoria Brown
Bought by
Polk Victoria
Create a Home Valuation Report for This Property
The Home Valuation Report is an in-depth analysis detailing your home's value as well as a comparison with similar homes in the area
Home Values in the Area
Average Home Value in this Area
Purchase History
| Date | Buyer | Sale Price | Title Company |
|---|---|---|---|
| Johnson Alfred David | -- | None Available | |
| Johnson Alfred David | -- | None Available | |
| The Alfred David Johnson Living Trust | -- | None Available | |
| Alfred David Johnson Living Trust | -- | Cohen Michael | |
| Johnson A David | $955,000 | Placer Title Company | |
| Polk Victoria | -- | -- |
Source: Public Records
Tax History
| Year | Tax Paid | Tax Assessment Tax Assessment Total Assessment is a certain percentage of the fair market value that is determined by local assessors to be the total taxable value of land and additions on the property. | Land | Improvement |
|---|---|---|---|---|
| 2025 | $19,975 | $1,392,433 | $376,297 | $1,016,136 |
| 2024 | $19,975 | $1,365,135 | $368,920 | $996,215 |
| 2023 | $19,578 | $1,338,376 | $361,689 | $976,687 |
| 2022 | $19,262 | $1,312,137 | $354,598 | $957,539 |
| 2021 | $19,333 | $1,286,418 | $347,647 | $938,771 |
| 2020 | $18,367 | $1,273,230 | $344,083 | $929,147 |
| 2019 | $17,726 | $1,248,274 | $337,339 | $910,935 |
| 2018 | $17,451 | $1,223,806 | $330,727 | $893,079 |
| 2017 | $16,864 | $1,199,814 | $324,243 | $875,571 |
| 2016 | $16,385 | $1,176,290 | $317,886 | $858,404 |
| 2015 | $16,177 | $1,158,628 | $313,112 | $845,516 |
| 2014 | $16,087 | $1,135,940 | $306,981 | $828,959 |
Source: Public Records
Map
Nearby Homes
- 2501 Rose Walk
- 2893 Buena Vista Way
- 2600 Hilgard Ave
- 1471 Scenic Ave
- 1698 La Loma Ave Unit 1698
- 2477 Virginia St
- 1622 Scenic Ave
- 2634 Virginia St Unit 13
- 2686 Shasta Rd
- 2451 Le Conte Ave
- 2365 Virginia St Unit 2
- 2700 Le Conte Ave Unit 301
- 2700 Le Conte Ave Unit 402
- 2340 Virginia St
- 1519 Oxford St Unit E
- 1412 Oxford St
- 1179 Keith Ave
- 2315 Eunice St
- 1444 Walnut St
- 2201 Virginia St Unit 2
- 2573 Buena Vista Way
- 2565 Buena Vista Way
- 2587 Buena Vista Way
- 1509 Le Roy Ave
- 1517 Le Roy Ave
- 1505 Le Roy Ave
- 2545 Buena Vista Way
- 2593 Buena Vista Way
- 2555 Buena Vista Way
- 1501 Le Roy Ave
- 1521 Le Roy Ave
- 2580 Buena Vista Way
- 2574 Buena Vista Way
- 2600 Buena Vista Way
- 2597 Buena Vista Way Unit B East
- 2597 Buena Vista Way
- 2564 Buena Vista Way
- 1497 Le Roy Ave
- 0 Le Roy Unit 40755477
- 0 Le Roy Unit 41018993
Your Personal Tour Guide
Ask me questions while you tour the home.