Estimated Value: $656,951 - $768,000
3
Beds
3
Baths
3,517
Sq Ft
$201/Sq Ft
Est. Value
About This Home
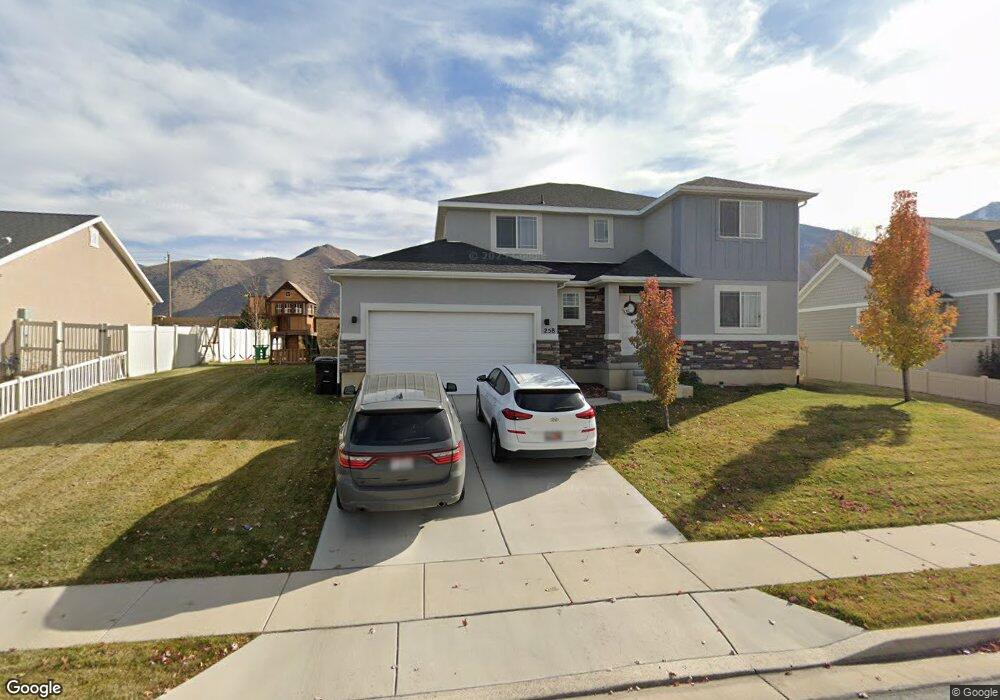
This home is located at 258 N 900 E Unit 19, Salem, UT 84653 and is currently estimated at $706,984, approximately $201 per square foot. 258 N 900 E Unit 19 is a home located in Utah County with nearby schools including Salem Elementary, Valley View Middle School, and Salem Junior High School.
Ownership History
Date
Name
Owned For
Owner Type
Purchase Details
Closed on
Nov 27, 2018
Sold by
Kestrel Construction Inc
Bought by
Mitchell Robert R and Mitchell Jennifer L
Current Estimated Value
Home Financials for this Owner
Home Financials are based on the most recent Mortgage that was taken out on this home.
Original Mortgage
$302,400
Outstanding Balance
$266,953
Interest Rate
4.9%
Mortgage Type
New Conventional
Estimated Equity
$440,031
Purchase Details
Closed on
Apr 6, 2018
Sold by
Mahawi Development Llc
Bought by
Kestrel Construction Inc
Purchase Details
Closed on
Apr 13, 2007
Sold by
Nielsen Richard Page and Evans Matthew Morgan
Bought by
Mahawi Development Llc
Create a Home Valuation Report for This Property
The Home Valuation Report is an in-depth analysis detailing your home's value as well as a comparison with similar homes in the area
Home Values in the Area
Average Home Value in this Area
Purchase History
| Date | Buyer | Sale Price | Title Company |
|---|---|---|---|
| Mitchell Robert R | -- | Inwest Title | |
| Kestrel Construction Inc | -- | Inwest Title | |
| Mahawi Development Llc | -- | Access Title Company |
Source: Public Records
Mortgage History
| Date | Status | Borrower | Loan Amount |
|---|---|---|---|
| Open | Mitchell Robert R | $302,400 |
Source: Public Records
Tax History
| Year | Tax Paid | Tax Assessment Tax Assessment Total Assessment is a certain percentage of the fair market value that is determined by local assessors to be the total taxable value of land and additions on the property. | Land | Improvement |
|---|---|---|---|---|
| 2025 | $3,012 | $330,000 | -- | -- |
| 2024 | $3,012 | $305,470 | $0 | $0 |
| 2023 | $3,073 | $312,235 | $0 | $0 |
| 2022 | $3,138 | $313,940 | $0 | $0 |
| 2021 | $2,458 | $394,500 | $126,000 | $268,500 |
| 2020 | $2,387 | $372,800 | $109,600 | $263,200 |
| 2019 | $2,240 | $357,300 | $106,100 | $251,200 |
| 2018 | $1,139 | $95,500 | $95,500 | $0 |
| 2017 | $1,044 | $84,900 | $0 | $0 |
| 2016 | $1,012 | $81,300 | $0 | $0 |
| 2015 | $896 | $70,700 | $0 | $0 |
| 2014 | $698 | $55,200 | $0 | $0 |
Source: Public Records
Map
Nearby Homes
- 313 E 1040 S
- 974 E 400 St N
- 974 E 400 St N Unit 1
- 2165 E 270 N Unit MSF47
- 2153 E 270 N Unit MSF48
- 2152 E 270 N Unit MSF50
- 2174 E 270 N Unit MSF51
- 2148 E 270 N Unit MSF49
- 384 N 710 E
- 655-1206 N 1850 E
- 6 Shady Ln
- 88 S 850 E
- 438 N 500 E Unit LOT 2
- 794 E 110 S Unit 13
- 84 N 500 E
- 672 N 500 E Unit 115
- 644 N 500 E Unit 111
- 513 E 400 North St
- 846 E 400 St N
- 443 N 500 E Unit LOT 2
- 244 N 900 E
- 278 N 900 E Unit 18
- 278 N 900 E
- 884 E 270 N
- 884 E 270 N Unit 49
- 228 N 900 E
- 228 N 900 E Unit 21
- 292 N 900 E Unit 17
- 287 N 900 E Unit 33
- 287 N 900 E
- 887 E 220 N Unit 50
- 887 E 220 N
- 871 E 270 N
- 868 E 270 N Unit 48
- 212 N 900 E Unit 22
- 212 N 900 E
- 308 N 900 E Unit 16
- 308 N 900 E
- 303 N 900 E
- 875 E 220 N
Your Personal Tour Guide
Ask me questions while you tour the home.