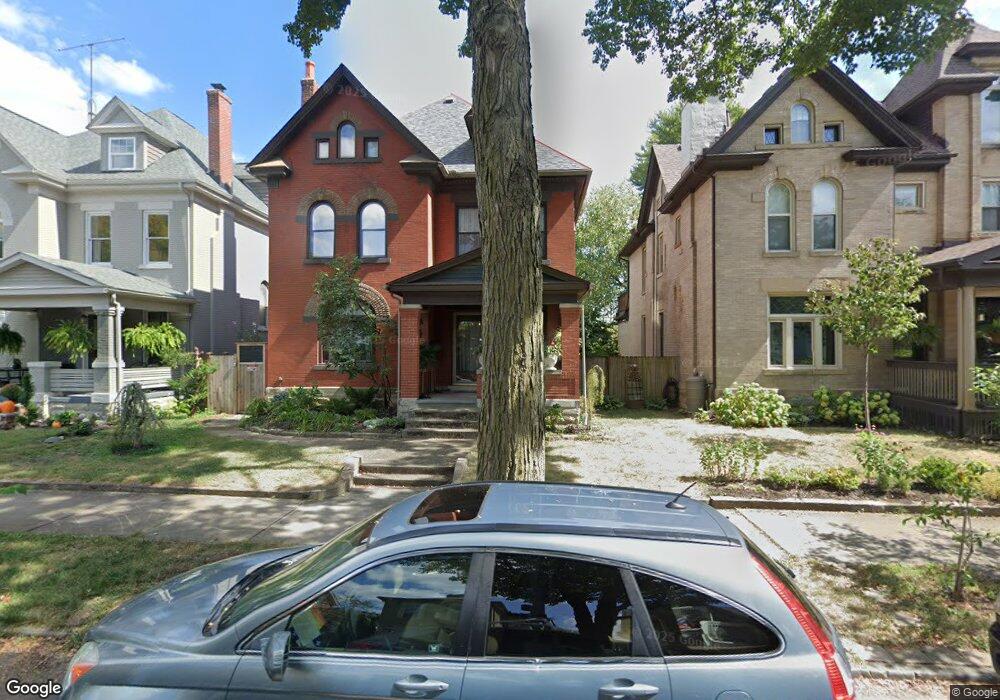
258 S 17th St Columbus, OH 43205
Olde Towne East NeighborhoodEstimated Value: $388,455 - $465,000
3
Beds
3
Baths
2,344
Sq Ft
$189/Sq Ft
Est. Value
About This Home
This home is located at 258 S 17th St, Columbus, OH 43205 and is currently estimated at $442,114, approximately $188 per square foot. 258 S 17th St is a home located in Franklin County with nearby schools including Ohio Avenue Elementary School, Champion Middle School, and East High School.
Ownership History
Date
Name
Owned For
Owner Type
Purchase Details
Closed on
Nov 17, 2003
Sold by
Romig Melissa A and Wise Katherine J
Bought by
Villamena Frederick
Current Estimated Value
Purchase Details
Closed on
Jun 20, 1997
Sold by
Rogers Darryl G and Rogers Kimberly R
Bought by
Romig Melissa A and Wise Katherine J
Home Financials for this Owner
Home Financials are based on the most recent Mortgage that was taken out on this home.
Original Mortgage
$121,400
Interest Rate
8%
Purchase Details
Closed on
Jan 5, 1993
Purchase Details
Closed on
Nov 1, 1983
Create a Home Valuation Report for This Property
The Home Valuation Report is an in-depth analysis detailing your home's value as well as a comparison with similar homes in the area
Home Values in the Area
Average Home Value in this Area
Purchase History
| Date | Buyer | Sale Price | Title Company |
|---|---|---|---|
| Villamena Frederick | $212,000 | -- | |
| Romig Melissa A | $134,900 | Chicago Title | |
| -- | $85,500 | -- | |
| -- | -- | -- |
Source: Public Records
Mortgage History
| Date | Status | Borrower | Loan Amount |
|---|---|---|---|
| Previous Owner | Romig Melissa A | $121,400 |
Source: Public Records
Tax History Compared to Growth
Tax History
| Year | Tax Paid | Tax Assessment Tax Assessment Total Assessment is a certain percentage of the fair market value that is determined by local assessors to be the total taxable value of land and additions on the property. | Land | Improvement |
|---|---|---|---|---|
| 2024 | $4,523 | $100,770 | $22,960 | $77,810 |
| 2023 | $4,465 | $100,770 | $22,960 | $77,810 |
| 2022 | $3,386 | $65,280 | $1,750 | $63,530 |
| 2021 | $3,392 | $65,280 | $1,750 | $63,530 |
| 2020 | $3,396 | $65,280 | $1,750 | $63,530 |
| 2019 | $3,302 | $54,430 | $1,470 | $52,960 |
| 2018 | $2,688 | $54,430 | $1,470 | $52,960 |
| 2017 | $2,797 | $54,430 | $1,470 | $52,960 |
| 2016 | $2,293 | $34,620 | $3,330 | $31,290 |
| 2015 | $2,082 | $34,620 | $3,330 | $31,290 |
| 2014 | $2,087 | $34,620 | $3,330 | $31,290 |
| 2013 | $1,083 | $36,435 | $3,500 | $32,935 |
Source: Public Records
Map
Nearby Homes
- 828 E Main St
- 240-242 S 18th St
- 308 Carpenter St
- 263 S 20th St
- 897 Mcallister Ave
- 847 Franklin Ave
- 977 Bryden Rd
- 940 Mcallister Ave
- 991 Bryden Rd Unit 993
- 947 Mcallister Ave
- 136 S Garfield Ave
- 143 S Garfield Ave
- 962 Franklin Ave
- 972 Franklin Ave
- 955 E Mound St
- 41 S Garfield Ave
- 1033-1035 Franklin Ave
- 726 Franklin Ave
- 732 Franklin Ave Unit 723
- 1046 E Cherry St
- 262 S 17th St
- 252 S 17th St
- 248 S 17th St
- 270 S 17th St Unit 272
- 242 S 17th St
- 276 S 17th St
- 234 S 17th St Unit 236
- 234-236 S 17th St
- 269 S 18th St
- 259 S 18th St
- 255 S 17th St
- 249 S 17th St
- 253 S 18th St
- 265 S 18th St
- 277 S 18th St
- 261 S 17th St Unit 263
- 261 S 17th St Unit 2
- 228 S 17th St
- 269 S 17th St
- 286 S 17th St Unit 288