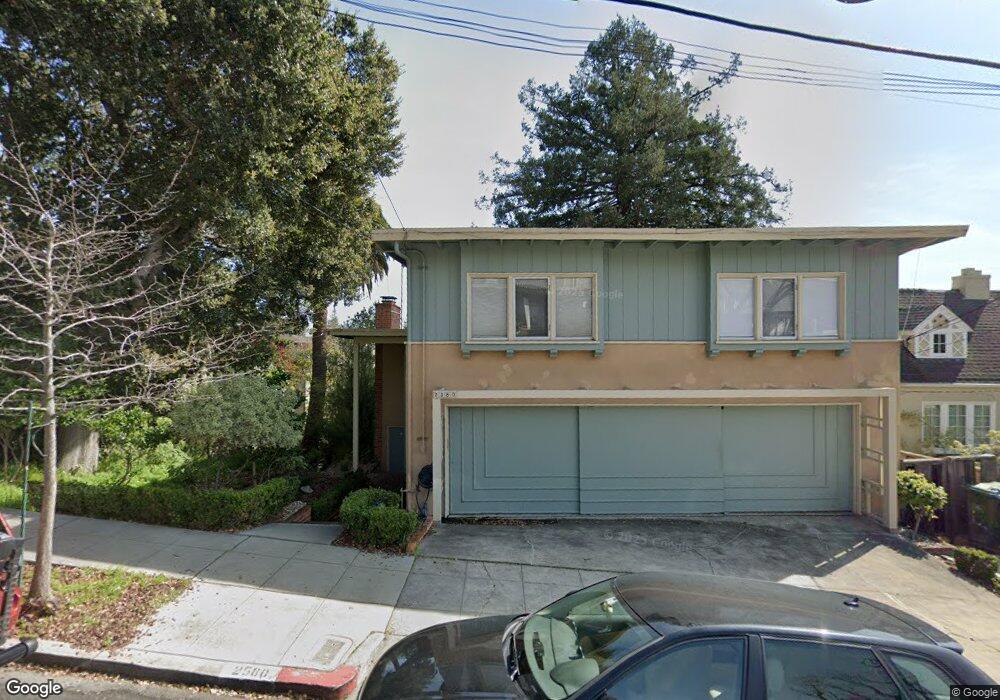
2580 Hilgard Ave Berkeley, CA 94709
North Berkeley NeighborhoodEstimated Value: $1,230,431 - $2,146,000
4
Beds
4
Baths
2,428
Sq Ft
$729/Sq Ft
Est. Value
About This Home
This home is located at 2580 Hilgard Ave, Berkeley, CA 94709 and is currently estimated at $1,769,858, approximately $728 per square foot. 2580 Hilgard Ave is a home located in Alameda County with nearby schools including Berkeley Arts Magnet at Whittier School, Washington Elementary School, and Cragmont Elementary School.
Ownership History
Date
Name
Owned For
Owner Type
Purchase Details
Closed on
May 3, 2023
Sold by
Zamanian Claude and Zamanian Alison
Bought by
Ac Zamanian Trust
Current Estimated Value
Purchase Details
Closed on
Jun 3, 1997
Sold by
Zamanian Claude and Zamanian Alison
Bought by
Zamanian Claude and Zamanian Alison
Purchase Details
Closed on
Feb 23, 1996
Sold by
Zamanian Claude and Zamanian Alison
Bought by
Zamanian Claude and Zamanian Alison
Home Financials for this Owner
Home Financials are based on the most recent Mortgage that was taken out on this home.
Original Mortgage
$248,000
Interest Rate
7.1%
Purchase Details
Closed on
Feb 13, 1996
Sold by
Lewis Dorothy J
Bought by
Zamanian Claude and Zamanian Alison
Home Financials for this Owner
Home Financials are based on the most recent Mortgage that was taken out on this home.
Original Mortgage
$248,000
Interest Rate
7.1%
Create a Home Valuation Report for This Property
The Home Valuation Report is an in-depth analysis detailing your home's value as well as a comparison with similar homes in the area
Home Values in the Area
Average Home Value in this Area
Purchase History
| Date | Buyer | Sale Price | Title Company |
|---|---|---|---|
| Ac Zamanian Trust | -- | None Listed On Document | |
| Zamanian Claude | -- | -- | |
| Zamanian Claude | -- | -- | |
| Zamanian Claude | $310,000 | American Title Ins Co |
Source: Public Records
Mortgage History
| Date | Status | Borrower | Loan Amount |
|---|---|---|---|
| Previous Owner | Zamanian Claude | $248,000 |
Source: Public Records
Tax History
| Year | Tax Paid | Tax Assessment Tax Assessment Total Assessment is a certain percentage of the fair market value that is determined by local assessors to be the total taxable value of land and additions on the property. | Land | Improvement |
|---|---|---|---|---|
| 2025 | $12,513 | $504,862 | $151,458 | $353,404 |
| 2024 | $12,513 | $494,964 | $148,489 | $346,475 |
| 2023 | $12,165 | $485,261 | $145,578 | $339,683 |
| 2022 | $12,013 | $475,747 | $142,724 | $333,023 |
| 2021 | $11,984 | $466,418 | $139,925 | $326,493 |
| 2020 | $11,142 | $461,638 | $138,491 | $323,147 |
| 2019 | $10,488 | $452,590 | $135,777 | $316,813 |
| 2018 | $10,235 | $443,717 | $133,115 | $310,602 |
| 2017 | $9,873 | $435,018 | $130,505 | $304,513 |
| 2016 | $9,376 | $426,491 | $127,947 | $298,544 |
| 2015 | $9,212 | $420,087 | $126,026 | $294,061 |
| 2014 | $9,060 | $411,858 | $123,557 | $288,301 |
Source: Public Records
Map
Nearby Homes
- 2600 Hilgard Ave
- 2634 Virginia St Unit 13
- 2700 Le Conte Ave Unit 301
- 2700 Le Conte Ave Unit 402
- 2704 Le Conte Ave Unit 4
- 2451 Le Conte Ave
- 2340 Virginia St
- 2201 Virginia St Unit 2
- 1444 Walnut St
- 0 Queens Rd Unit ML82024219
- 1375 Queens Rd
- 209 Fairlawn Dr
- 1136 Keith Ave
- 1468 Summit Rd
- 2015 Delaware St
- 2015 Delaware St Unit A
- 2012 Rose St
- 1610 Milvia St
- 1165 Cragmont Ave
- 1609 Bonita Ave Unit 3
- 2574 Hilgard Ave
- 1666 Le Roy Ave
- 2570 Hilgard Ave
- 1676 Le Roy Ave
- 1665 Le Roy Ave
- 2581 Virginia St
- 2583 Virginia St
- 2560 Hilgard Ave
- 2585 Virginia St
- 2587 Hilgard Ave Unit A
- 2593 Hilgard Ave Unit D
- 2589 Hilgard Ave Unit B
- 1675 Le Roy Ave
- 2591 Hilgard Ave Unit C
- 2597 Hilgard Ave
- 2597 Virginia St
- 2573 Virginia St
- 2571 Virginia St Unit 1
- 2628 Hilgard Ave
- 2605 Hilgard Ave
Your Personal Tour Guide
Ask me questions while you tour the home.