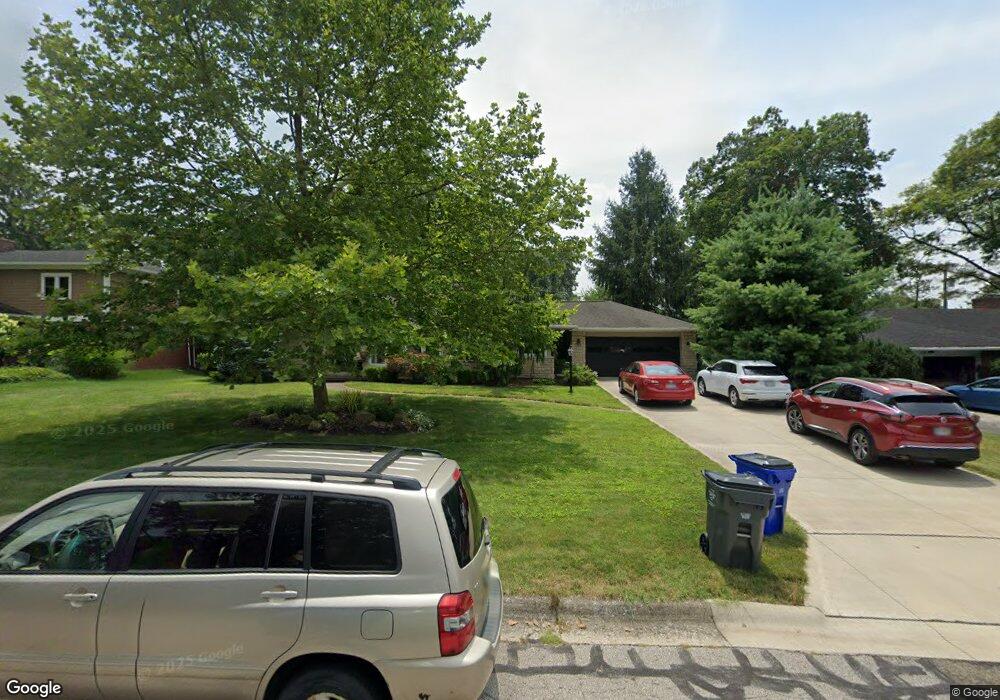
2581 Farleigh Rd Columbus, OH 43221
Estimated Value: $583,869 - $657,000
3
Beds
2
Baths
1,467
Sq Ft
$424/Sq Ft
Est. Value
About This Home
This home is located at 2581 Farleigh Rd, Columbus, OH 43221 and is currently estimated at $621,967, approximately $423 per square foot. 2581 Farleigh Rd is a home located in Franklin County with nearby schools including Tremont Elementary School, Jones Middle School, and Upper Arlington High School.
Ownership History
Date
Name
Owned For
Owner Type
Purchase Details
Closed on
Nov 15, 2002
Sold by
Noss Angela M and Morris Leonard W
Bought by
Gillie Carolyn W
Current Estimated Value
Home Financials for this Owner
Home Financials are based on the most recent Mortgage that was taken out on this home.
Original Mortgage
$210,300
Outstanding Balance
$89,380
Interest Rate
6.22%
Mortgage Type
Purchase Money Mortgage
Estimated Equity
$532,587
Purchase Details
Closed on
Dec 26, 1996
Sold by
Est Carl E Mcvay
Bought by
Morris Angela M Noss and Morris Leonard W
Home Financials for this Owner
Home Financials are based on the most recent Mortgage that was taken out on this home.
Original Mortgage
$144,000
Interest Rate
7.64%
Mortgage Type
Balloon
Create a Home Valuation Report for This Property
The Home Valuation Report is an in-depth analysis detailing your home's value as well as a comparison with similar homes in the area
Home Values in the Area
Average Home Value in this Area
Purchase History
| Date | Buyer | Sale Price | Title Company |
|---|---|---|---|
| Gillie Carolyn W | $262,900 | Chicago Title | |
| Morris Angela M Noss | $160,000 | -- |
Source: Public Records
Mortgage History
| Date | Status | Borrower | Loan Amount |
|---|---|---|---|
| Open | Gillie Carolyn W | $210,300 | |
| Previous Owner | Morris Angela M Noss | $144,000 |
Source: Public Records
Tax History Compared to Growth
Tax History
| Year | Tax Paid | Tax Assessment Tax Assessment Total Assessment is a certain percentage of the fair market value that is determined by local assessors to be the total taxable value of land and additions on the property. | Land | Improvement |
|---|---|---|---|---|
| 2024 | $10,613 | $192,500 | $134,400 | $58,100 |
| 2023 | $13,087 | $237,760 | $134,400 | $103,360 |
| 2022 | $17,269 | $178,220 | $89,040 | $89,180 |
| 2021 | $10,797 | $178,220 | $89,040 | $89,180 |
| 2020 | $10,390 | $178,220 | $89,040 | $89,180 |
| 2019 | $10,426 | $159,110 | $89,040 | $70,070 |
| 2018 | $8,762 | $159,110 | $89,040 | $70,070 |
| 2017 | $10,346 | $159,110 | $89,040 | $70,070 |
| 2016 | $7,163 | $117,080 | $50,790 | $66,290 |
| 2015 | $7,156 | $117,080 | $50,790 | $66,290 |
| 2014 | $7,164 | $117,080 | $50,790 | $66,290 |
| 2013 | $3,394 | $106,435 | $46,165 | $60,270 |
Source: Public Records
Map
Nearby Homes
- 3163 S Dorchester Rd
- 2731 Clifton Rd
- 2785 Chateau Cir Unit 69
- 2782 Chateau Cir S Unit 45
- 3190 Kioka Ave
- 2544 Zollinger Rd
- 2979 Avalon Rd
- 3041 Avalon Rd
- 2370 Zollinger Rd
- 2527 Wickliffe Rd
- 2227 Zollinger Rd
- 2589 Olde Hill Ct N Unit 2589
- 2594 Scioto View Ln Unit 2594
- 2565 Nottingham Rd
- 2571 Scioto View Ln Unit K
- 2424 Nottingham Rd
- 2714 Woodstock Rd
- 2401 Shrewsbury Rd
- 3441 Sunset Dr
- 2308 Shrewsbury Rd
- 2595 Farleigh Rd
- 2567 Farleigh Rd
- 2584 Edington Rd
- 2596 Edington Rd
- 2570 Edington Rd
- 2553 Farleigh Rd
- 2570 Farleigh Rd
- 3020 S Dorchester Rd
- 3000 S Dorchester Rd
- 2614 Edington Rd
- 2554 Edington Rd
- 2541 Farleigh Rd
- 2544 Farleigh Rd
- 3038 S Dorchester Rd
- 2585 Edington Rd
- 3031 Herrick Rd
- 2577 Edington Rd
- 2611 Edington Rd
- 2630 Edington Rd
- 2565 Edington Rd