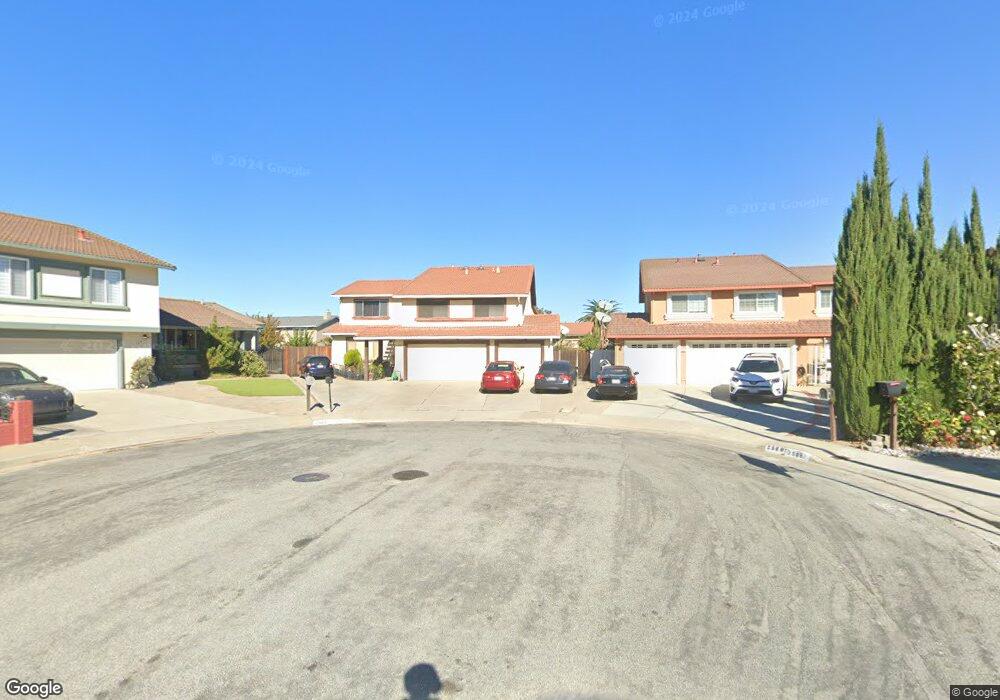
2581 Glen Hedge Ct San Jose, CA 95148
Hidden Glen NeighborhoodEstimated Value: $1,691,000 - $1,828,000
4
Beds
3
Baths
2,946
Sq Ft
$600/Sq Ft
Est. Value
About This Home
This home is located at 2581 Glen Hedge Ct, San Jose, CA 95148 and is currently estimated at $1,766,978, approximately $599 per square foot. 2581 Glen Hedge Ct is a home located in Santa Clara County with nearby schools including Cedar Grove Elementary School, George V. Leyva Intermediate School, and William C. Overfelt High School.
Ownership History
Date
Name
Owned For
Owner Type
Purchase Details
Closed on
Jan 12, 2012
Sold by
Ngo Rose Mai and Ngo Huan Hoang
Bought by
Ngo Vu H and Ngo Huan Hoang
Current Estimated Value
Home Financials for this Owner
Home Financials are based on the most recent Mortgage that was taken out on this home.
Original Mortgage
$250,000
Outstanding Balance
$28,644
Interest Rate
3.93%
Mortgage Type
New Conventional
Estimated Equity
$1,738,334
Purchase Details
Closed on
Jan 3, 2012
Sold by
Le Huyen
Bought by
Ngo Huan Hoang
Home Financials for this Owner
Home Financials are based on the most recent Mortgage that was taken out on this home.
Original Mortgage
$250,000
Outstanding Balance
$28,644
Interest Rate
3.93%
Mortgage Type
New Conventional
Estimated Equity
$1,738,334
Purchase Details
Closed on
Sep 1, 2006
Sold by
Ngo Khan V and Mai Lien K
Bought by
Ngo Vu H and Ngo Rose Mai
Home Financials for this Owner
Home Financials are based on the most recent Mortgage that was taken out on this home.
Original Mortgage
$267,000
Interest Rate
6.67%
Mortgage Type
Stand Alone First
Purchase Details
Closed on
Oct 5, 2002
Sold by
Ngo Khan V and Mai Lien K
Bought by
Ngo Khan and Mai Lien K
Home Financials for this Owner
Home Financials are based on the most recent Mortgage that was taken out on this home.
Original Mortgage
$300,000
Interest Rate
6.22%
Purchase Details
Closed on
Sep 27, 2002
Sold by
Ngo Khan V and Mai Lien K
Bought by
Ngo Khan and Mai Lien K
Home Financials for this Owner
Home Financials are based on the most recent Mortgage that was taken out on this home.
Original Mortgage
$300,000
Interest Rate
6.22%
Purchase Details
Closed on
May 14, 1999
Sold by
Banwait Jarnail S
Bought by
Ngo Khan and Mai Lien K
Home Financials for this Owner
Home Financials are based on the most recent Mortgage that was taken out on this home.
Original Mortgage
$318,750
Interest Rate
6.86%
Purchase Details
Closed on
Mar 2, 1999
Sold by
Banwait Jarnail S and Banwait Kiran Jit
Bought by
Banwait Jarnail S and Banwait Kiran Jit
Home Financials for this Owner
Home Financials are based on the most recent Mortgage that was taken out on this home.
Original Mortgage
$193,000
Interest Rate
6.7%
Purchase Details
Closed on
Nov 1, 1996
Sold by
Banwait Davinder S
Bought by
Banwait Jarnail S and Banwait Kiran
Purchase Details
Closed on
Oct 15, 1993
Sold by
First Carl L and First Ruth
Bought by
Banwait Davinder S and Banwait Anita
Home Financials for this Owner
Home Financials are based on the most recent Mortgage that was taken out on this home.
Original Mortgage
$203,150
Interest Rate
6.95%
Create a Home Valuation Report for This Property
The Home Valuation Report is an in-depth analysis detailing your home's value as well as a comparison with similar homes in the area
Home Values in the Area
Average Home Value in this Area
Purchase History
| Date | Buyer | Sale Price | Title Company |
|---|---|---|---|
| Ngo Vu H | $75,000 | Fidelity National Title Co | |
| Ngo Huan Hoang | -- | Fidelity National Title Co | |
| Ngo Vu H | $178,000 | Commonwealth Land Title | |
| Ngo Khan | -- | Chicago Title Company | |
| Ngo Khan | -- | Chicago Title | |
| Ngo Khan | $415,000 | Old Republic Title Company | |
| Banwait Jarnail S | -- | Financial Title Company | |
| Banwait Jarnail S | -- | -- | |
| Banwait Davinder S | $276,000 | Old Republic Title Company |
Source: Public Records
Mortgage History
| Date | Status | Borrower | Loan Amount |
|---|---|---|---|
| Open | Ngo Vu H | $250,000 | |
| Previous Owner | Ngo Vu H | $267,000 | |
| Previous Owner | Ngo Khan | $300,000 | |
| Previous Owner | Ngo Khan | $318,750 | |
| Previous Owner | Banwait Jarnail S | $193,000 | |
| Previous Owner | Banwait Davinder S | $203,150 |
Source: Public Records
Tax History Compared to Growth
Tax History
| Year | Tax Paid | Tax Assessment Tax Assessment Total Assessment is a certain percentage of the fair market value that is determined by local assessors to be the total taxable value of land and additions on the property. | Land | Improvement |
|---|---|---|---|---|
| 2025 | $9,906 | $655,611 | $276,670 | $378,941 |
| 2024 | $9,906 | $642,757 | $271,246 | $371,511 |
| 2023 | $9,705 | $630,155 | $265,928 | $364,227 |
| 2022 | $9,648 | $617,800 | $260,714 | $357,086 |
| 2021 | $9,465 | $605,687 | $255,602 | $350,085 |
| 2020 | $9,055 | $599,478 | $252,982 | $346,496 |
| 2019 | $8,823 | $587,724 | $248,022 | $339,702 |
| 2018 | $8,727 | $576,201 | $243,159 | $333,042 |
| 2017 | $8,589 | $564,904 | $238,392 | $326,512 |
| 2016 | $8,193 | $553,828 | $233,718 | $320,110 |
| 2015 | $8,085 | $545,510 | $230,208 | $315,302 |
| 2014 | $7,372 | $534,825 | $225,699 | $309,126 |
Source: Public Records
Map
Nearby Homes
- 2708 Glen Ferguson Cir
- 2955 Vineyard Park Dr
- 2707 Sugarplum Dr
- 2666 Hesselbein Way
- 2715 Sugarplum Dr
- 2689 Vista Verde Dr
- 2805 Gavilan Dr
- 3324 Trebol Ln
- 2552 Castleton Dr
- 3343 Quesada Dr
- 3344 Quesada Dr
- 3388 San Saba Dr
- 2277 Flint Ave
- 2896 Rathmann Dr
- 2017 Flintbury Ct
- 2885 Mantis Dr
- 3368 Thrift Place
- 2837 Mantis Dr
- 2195 Cunningham Ct
- 2574 Whispering Hills Cir Unit 2574
- 2589 Glen Hedge Ct
- 2580 Glen Hedge Ct
- 2932 Glen Craig Ct
- 2928 Glen Craig Ct
- 2936 Glen Craig Ct
- 2597 Glen Hedge Ct
- 2590 Glen Fall Ct
- 2588 Glen Hedge Ct
- 2924 Glen Craig Ct
- 2596 Glen Hedge Ct
- 2598 Glen Fall Ct
- 2920 Glen Craig Ct
- 2939 Glen Craig Ct
- 2585 Glen Fall Ct
- 2916 Glen Craig Ct
- 2927 Glen Craig Ct
- 2613 Glen Harwick Ct
- 2931 Glen Craig Ct
- 2923 Glen Craig Ct
- 2935 Glen Craig Ct