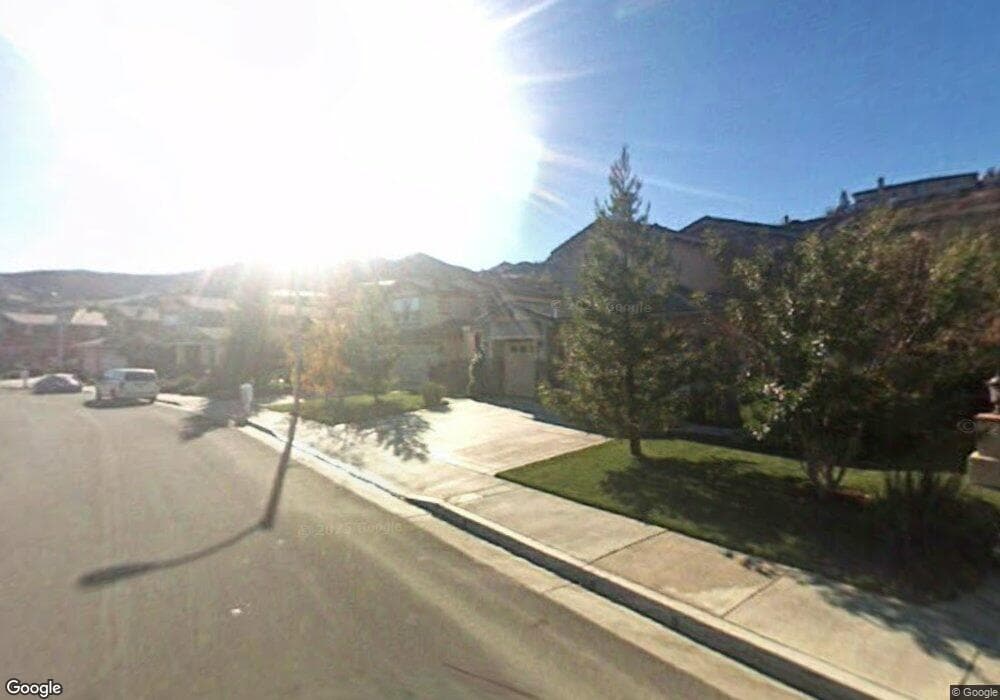
25842 Royal Oaks Rd Stevenson Ranch, CA 91381
Estimated Value: $1,230,178 - $1,537,000
5
Beds
4
Baths
3,229
Sq Ft
$434/Sq Ft
Est. Value
About This Home
This home is located at 25842 Royal Oaks Rd, Stevenson Ranch, CA 91381 and is currently estimated at $1,401,545, approximately $434 per square foot. 25842 Royal Oaks Rd is a home located in Los Angeles County with nearby schools including Pico Canyon Elementary School, Rancho Pico Junior High School, and West Ranch High School.
Ownership History
Date
Name
Owned For
Owner Type
Purchase Details
Closed on
May 12, 2011
Sold by
Torgesen David K and Torgesen Laura W
Bought by
Torgesen David K and Torgesen Laura W
Current Estimated Value
Purchase Details
Closed on
Apr 16, 2009
Sold by
Torgesen David K
Bought by
Torgesen David K and Torgesen Laura W
Home Financials for this Owner
Home Financials are based on the most recent Mortgage that was taken out on this home.
Original Mortgage
$410,000
Outstanding Balance
$260,297
Interest Rate
5.02%
Mortgage Type
New Conventional
Estimated Equity
$1,141,248
Purchase Details
Closed on
Oct 9, 2006
Sold by
Torgesen David K and Torgesen Paola A
Bought by
Torgesen David K
Purchase Details
Closed on
Aug 20, 2002
Sold by
Wl Homes Llc
Bought by
Torgesen David K and Torgesen Paola A
Home Financials for this Owner
Home Financials are based on the most recent Mortgage that was taken out on this home.
Original Mortgage
$460,890
Interest Rate
5.79%
Create a Home Valuation Report for This Property
The Home Valuation Report is an in-depth analysis detailing your home's value as well as a comparison with similar homes in the area
Home Values in the Area
Average Home Value in this Area
Purchase History
| Date | Buyer | Sale Price | Title Company |
|---|---|---|---|
| Torgesen David K | -- | None Available | |
| Torgesen David K | -- | None Available | |
| Torgesen David K | -- | First American Title Co La | |
| Torgesen David K | -- | None Available | |
| Torgesen David K | $576,500 | First American Title Co |
Source: Public Records
Mortgage History
| Date | Status | Borrower | Loan Amount |
|---|---|---|---|
| Open | Torgesen David K | $410,000 | |
| Previous Owner | Torgesen David K | $460,890 |
Source: Public Records
Tax History Compared to Growth
Tax History
| Year | Tax Paid | Tax Assessment Tax Assessment Total Assessment is a certain percentage of the fair market value that is determined by local assessors to be the total taxable value of land and additions on the property. | Land | Improvement |
|---|---|---|---|---|
| 2025 | $10,744 | $834,360 | $393,067 | $441,293 |
| 2024 | $10,744 | $818,001 | $385,360 | $432,641 |
| 2023 | $10,379 | $801,962 | $377,804 | $424,158 |
| 2022 | $10,226 | $786,239 | $370,397 | $415,842 |
| 2021 | $10,051 | $770,824 | $363,135 | $407,689 |
| 2019 | $9,692 | $747,963 | $352,365 | $395,598 |
| 2018 | $9,510 | $733,298 | $345,456 | $387,842 |
| 2016 | $8,953 | $704,826 | $332,043 | $372,783 |
| 2015 | $8,783 | $694,240 | $327,056 | $367,184 |
| 2014 | $8,630 | $680,642 | $320,650 | $359,992 |
Source: Public Records
Map
Nearby Homes
- 24910 Old Stone Way
- 26211 Reade Place
- 26012 Franklin Ln
- 27462 Lumber Pine Place
- 26246 Reade Place
- 25518 Hemingway Ave Unit A
- 25530 Hemingway Ave
- 25463 Hardy Place
- 25507 Longfellow Place
- 26511 Brooks Cir
- 25528 Paine Cir
- 25531 Durant Place
- 25614 Lewis Way
- 27632 Ensemble Place
- 27636 Symphony Place
- 25510 Chisom Ln
- 26505 Thackery Ln
- 25535 Chisom Ln
- 25803 Anderson Ln
- 26666 Beartown Ln
- 25846 Royal Oaks Rd
- 25836 Royal Oaks Rd
- 25852 Royal Oaks Rd
- 25832 Royal Oaks Rd
- 25841 Royal Oaks Rd
- 25858 Royal Oaks Rd
- 25833 Royal Oaks Rd
- 25849 Royal Oaks Rd
- 25824 Royal Oaks Rd
- 25851 Royal Oaks Rd
- 25864 Royal Oaks Rd
- 25818 Royal Oaks Rd
- 25083 Blue Ridge Way
- 25853 Tulip Grove St
- 25833 Tulip Grove St
- 25906 Royal Oaks Rd
- 25068 Blue Ridge Way
- 25821 Tulip Grove St
- 25812 Royal Oaks Rd
- 25879 Tulip Grove St