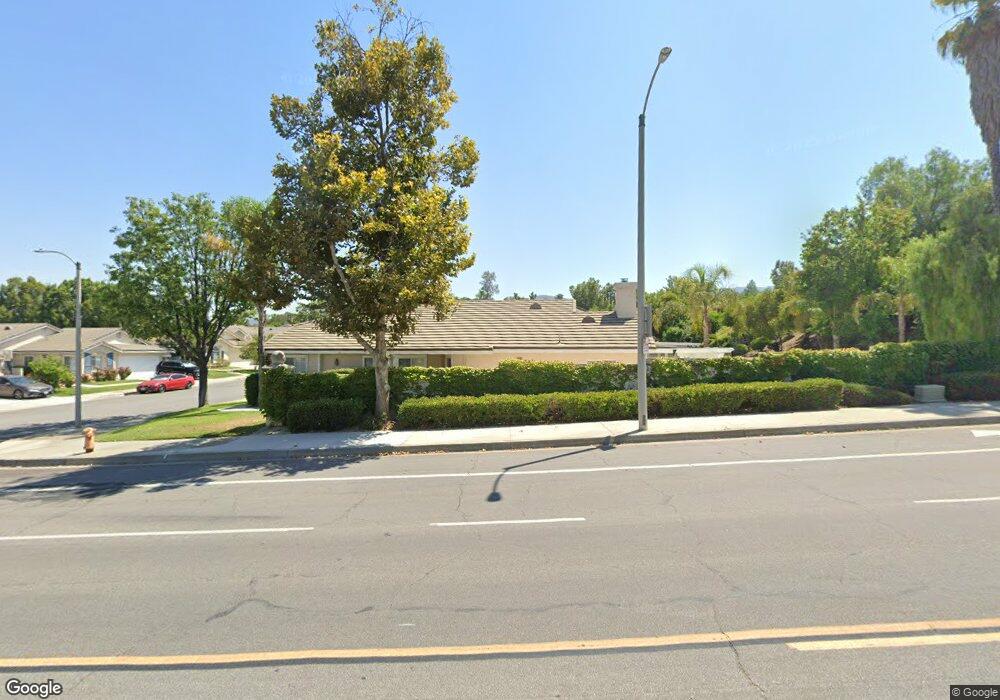
25869 Webster Place Stevenson Ranch, CA 91381
Estimated Value: $751,000 - $929,000
3
Beds
2
Baths
1,257
Sq Ft
$660/Sq Ft
Est. Value
About This Home
This home is located at 25869 Webster Place, Stevenson Ranch, CA 91381 and is currently estimated at $830,078, approximately $660 per square foot. 25869 Webster Place is a home located in Los Angeles County with nearby schools including Pico Canyon Elementary School, Rancho Pico Junior High School, and West Ranch High School.
Ownership History
Date
Name
Owned For
Owner Type
Purchase Details
Closed on
Dec 14, 2025
Sold by
Valipour Sina and Valipour Candice Stewart
Bought by
Valipour Candice Stewart and Valipour Sina
Current Estimated Value
Home Financials for this Owner
Home Financials are based on the most recent Mortgage that was taken out on this home.
Original Mortgage
$180,000
Outstanding Balance
$179,656
Interest Rate
6.22%
Mortgage Type
New Conventional
Estimated Equity
$650,422
Purchase Details
Closed on
Apr 19, 2010
Sold by
Us Bank National Association
Bought by
Valipour Sina and Valipour Candice Stewart
Home Financials for this Owner
Home Financials are based on the most recent Mortgage that was taken out on this home.
Original Mortgage
$384,817
Interest Rate
4.75%
Mortgage Type
FHA
Purchase Details
Closed on
Sep 21, 2009
Sold by
Paniagua Salvador
Bought by
Us Bank National Association
Purchase Details
Closed on
Nov 17, 2003
Sold by
Paniagua Salvador
Bought by
Paniagua Evelyn
Home Financials for this Owner
Home Financials are based on the most recent Mortgage that was taken out on this home.
Original Mortgage
$301,600
Interest Rate
5.89%
Mortgage Type
Stand Alone First
Purchase Details
Closed on
Oct 30, 2003
Sold by
Dutton Nicholas S
Bought by
Paniagua Salvador
Home Financials for this Owner
Home Financials are based on the most recent Mortgage that was taken out on this home.
Original Mortgage
$301,600
Interest Rate
5.89%
Mortgage Type
Stand Alone First
Purchase Details
Closed on
Oct 21, 2003
Sold by
Paniagua Evelyn
Bought by
Paniagua Salvador
Home Financials for this Owner
Home Financials are based on the most recent Mortgage that was taken out on this home.
Original Mortgage
$301,600
Interest Rate
5.89%
Mortgage Type
Stand Alone First
Purchase Details
Closed on
Nov 29, 2000
Sold by
Caldwell Ben
Bought by
Caldwell Sara C
Home Financials for this Owner
Home Financials are based on the most recent Mortgage that was taken out on this home.
Original Mortgage
$225,900
Interest Rate
7.66%
Purchase Details
Closed on
May 19, 1998
Sold by
Rigor Ivan J and Yu Connie
Bought by
Caldwell Ben and Caldwell Sara C
Home Financials for this Owner
Home Financials are based on the most recent Mortgage that was taken out on this home.
Original Mortgage
$196,650
Interest Rate
7.03%
Purchase Details
Closed on
Apr 22, 1996
Sold by
Dale Poe Development Corp
Bought by
Rigor Ivan J and Yu Connie
Home Financials for this Owner
Home Financials are based on the most recent Mortgage that was taken out on this home.
Original Mortgage
$141,550
Interest Rate
8.01%
Mortgage Type
Seller Take Back
Create a Home Valuation Report for This Property
The Home Valuation Report is an in-depth analysis detailing your home's value as well as a comparison with similar homes in the area
Home Values in the Area
Average Home Value in this Area
Purchase History
| Date | Buyer | Sale Price | Title Company |
|---|---|---|---|
| Valipour Candice Stewart | -- | Provident Title Company | |
| Valipour Sina | $390,000 | Lawyers Title Company | |
| Us Bank National Association | $285,000 | Accommodation | |
| Paniagua Evelyn | -- | First American Title Co | |
| Paniagua Salvador | $377,000 | First Southwestern Title Co | |
| Paniagua Salvador | -- | First Southwestern Title Co | |
| Caldwell Sara C | -- | South Coast Title | |
| Caldwell Ben | $207,000 | Southland Title | |
| Rigor Ivan J | $177,000 | Chicago Title Co |
Source: Public Records
Mortgage History
| Date | Status | Borrower | Loan Amount |
|---|---|---|---|
| Open | Valipour Candice Stewart | $180,000 | |
| Previous Owner | Valipour Sina | $384,817 | |
| Previous Owner | Paniagua Salvador | $301,600 | |
| Previous Owner | Caldwell Sara C | $225,900 | |
| Previous Owner | Caldwell Ben | $196,650 | |
| Previous Owner | Rigor Ivan J | $141,550 |
Source: Public Records
Tax History
| Year | Tax Paid | Tax Assessment Tax Assessment Total Assessment is a certain percentage of the fair market value that is determined by local assessors to be the total taxable value of land and additions on the property. | Land | Improvement |
|---|---|---|---|---|
| 2025 | $7,600 | $503,404 | $369,555 | $133,849 |
| 2024 | $7,600 | $493,534 | $362,309 | $131,225 |
| 2023 | $7,401 | $483,857 | $355,205 | $128,652 |
| 2022 | $7,266 | $474,371 | $348,241 | $126,130 |
| 2021 | $7,109 | $465,070 | $341,413 | $123,657 |
| 2019 | $6,860 | $451,279 | $331,288 | $119,991 |
| 2018 | $6,600 | $442,432 | $324,793 | $117,639 |
| 2016 | $6,263 | $425,254 | $312,182 | $113,072 |
| 2015 | $6,138 | $418,867 | $307,493 | $111,374 |
| 2014 | $5,929 | $410,663 | $301,470 | $109,193 |
Source: Public Records
Map
Nearby Homes
- 25858 Webster Place
- 25845 Anderson Ln
- 25837 Anderson Ln
- 25713 Wordsworth Ln
- 25947 Stafford Canyon Rd Unit G
- 25803 Anderson Ln
- 26056 Ohara Ln
- 25553 Fitzgerald Ave
- 25558 Fitzgerald Ave
- 25554 Schubert Cir
- 25640 Shaw Place
- 26089 Salinger Ln
- 26013 Twain Place
- 25725 Perlman Place Unit 127
- 25603 Shaw Place
- 25530 Hemingway Ave
- 25550 Longfellow Place
- 25258 Steinbeck Ave Unit F
- 25546 Hardy Place
- 25535 Chisom Ln
- 25863 Webster Place
- 25857 Webster Place
- 25860 London Place
- 25851 Webster Place
- 25854 London Place
- 25808 Wordsworth Ln
- 25870 Webster Place
- 25864 Webster Place
- 25820 Wordsworth Ln
- 25812 Wordsworth Ln
- 25850 London Place
- 25816 Wordsworth Ln
- 25804 Wordsworth Ln
- 25847 Webster Place
- 25824 Wordsworth Ln
- 25828 Wordsworth Ln
- 25852 Webster Place
- 25846 London Place
- 25832 Wordsworth Ln
- 25843 Webster Place
Your Personal Tour Guide
Ask me questions while you tour the home.