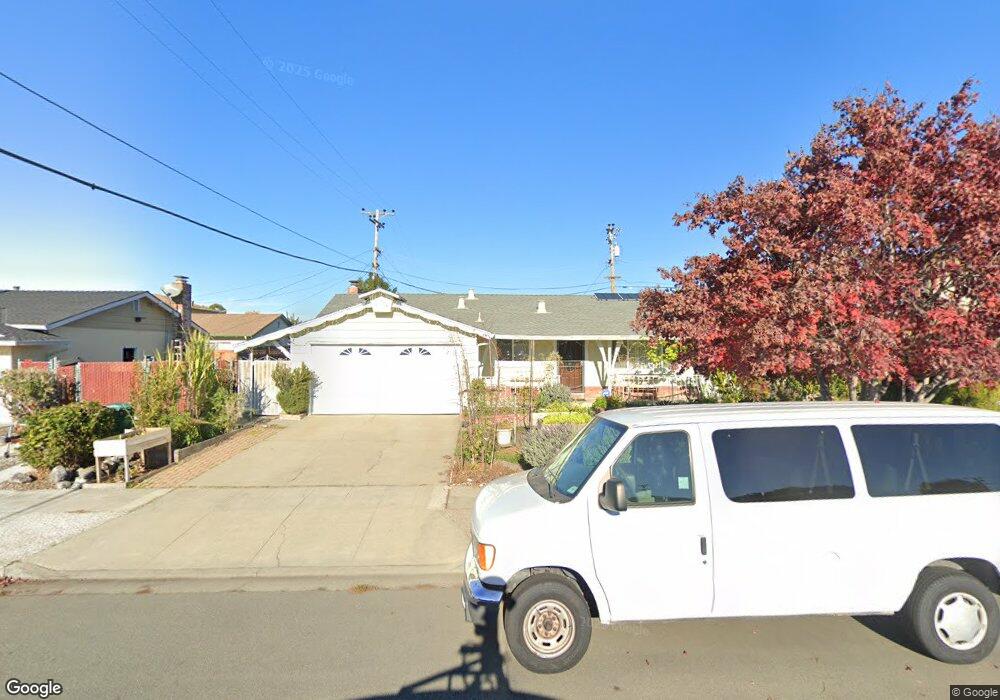
25873 Scripps St Hayward, CA 94545
Southgate NeighborhoodEstimated Value: $885,000 - $951,000
3
Beds
2
Baths
1,719
Sq Ft
$532/Sq Ft
Est. Value
About This Home
This home is located at 25873 Scripps St, Hayward, CA 94545 and is currently estimated at $913,706, approximately $531 per square foot. 25873 Scripps St is a home located in Alameda County with nearby schools including Eden Gardens Elementary School, Anthony W. Ochoa Middle School, and Mt. Eden High School.
Ownership History
Date
Name
Owned For
Owner Type
Purchase Details
Closed on
Mar 27, 2020
Sold by
Chow Simon Shu Kwin and Chow Linda Suet
Bought by
Chow Simon Shu Kwin and Chow Linda Suet
Current Estimated Value
Purchase Details
Closed on
Sep 8, 2009
Sold by
Bank Of America National Association
Bought by
Chow Simon Shu Kwin and Chow Linda Suet Lan
Purchase Details
Closed on
May 30, 2009
Sold by
Arriola Efren
Bought by
Bank Of America National Association
Purchase Details
Closed on
Oct 9, 2006
Sold by
Frias Jeronimo and Frias Magdalena
Bought by
Arriola Efren
Home Financials for this Owner
Home Financials are based on the most recent Mortgage that was taken out on this home.
Original Mortgage
$510,400
Interest Rate
6.37%
Mortgage Type
Purchase Money Mortgage
Create a Home Valuation Report for This Property
The Home Valuation Report is an in-depth analysis detailing your home's value as well as a comparison with similar homes in the area
Home Values in the Area
Average Home Value in this Area
Purchase History
| Date | Buyer | Sale Price | Title Company |
|---|---|---|---|
| Chow Simon Shu Kwin | -- | None Available | |
| Chow Simon Shu Kwin | $350,000 | North American Title Company | |
| Bank Of America National Association | $289,000 | Servicelink | |
| Arriola Efren | $638,000 | Financial Title Company |
Source: Public Records
Mortgage History
| Date | Status | Borrower | Loan Amount |
|---|---|---|---|
| Previous Owner | Arriola Efren | $510,400 |
Source: Public Records
Tax History
| Year | Tax Paid | Tax Assessment Tax Assessment Total Assessment is a certain percentage of the fair market value that is determined by local assessors to be the total taxable value of land and additions on the property. | Land | Improvement |
|---|---|---|---|---|
| 2025 | $5,623 | $451,754 | $135,526 | $316,228 |
| 2024 | $5,623 | $442,900 | $132,870 | $310,030 |
| 2023 | $5,540 | $434,216 | $130,265 | $303,951 |
| 2022 | $5,434 | $425,704 | $127,711 | $297,993 |
| 2021 | $5,391 | $417,360 | $125,208 | $292,152 |
| 2020 | $5,332 | $413,083 | $123,925 | $289,158 |
| 2019 | $5,375 | $404,984 | $121,495 | $283,489 |
| 2018 | $5,048 | $397,046 | $119,114 | $277,932 |
| 2017 | $4,934 | $389,262 | $116,778 | $272,484 |
| 2016 | $4,649 | $381,632 | $114,489 | $267,143 |
| 2015 | $4,558 | $375,903 | $112,771 | $263,132 |
| 2014 | $4,331 | $368,542 | $110,562 | $257,980 |
Source: Public Records
Map
Nearby Homes
- 1510 Cathy Way
- 1280 Stanhope Ln Unit 246
- 25129 Copa Del Oro Dr Unit 147
- 25163 Copa Del Oro Dr Unit 202
- 25938 Kay Ave Unit 322
- 25164 Copa Del Oro Dr Unit 203
- 25164 Copa Del Oro Dr Unit 104
- 1256 Stanhope Ln Unit 254
- 1256 Stanhope Ln Unit 154
- 1256 Stanhope Ln Unit 251
- 26088 Kay Ave Unit 318
- 26088 Kay Ave Unit 209
- 26147 Danforth Ln
- 24704 Manzanita St
- 2274 Sleepy Hollow Ave
- 25321 Ironwood Ct
- 1131 Bishop Ave
- 2671 Hawthorne Ave
- 512 Teasdale Place
- 24839 Townsend Ave
- 25861 Scripps St
- 25885 Scripps St
- 25860 Seaver St
- 25870 Barnard St
- 25849 Scripps St
- 25882 Barnard St
- 25858 Barnard St
- 25874 Scripps St
- 25866 Scripps St
- 25837 Scripps St
- 25858 Scripps St
- 25836 Barnard St
- 25890 Seaver St
- 25825 Scripps St
- 25859 Seaver St
- 25867 Seaver St
- 25840 Scripps St
- 1487 Cathy Way
- 25881 Barnard St
- 25875 Seaver St
Your Personal Tour Guide
Ask me questions while you tour the home.