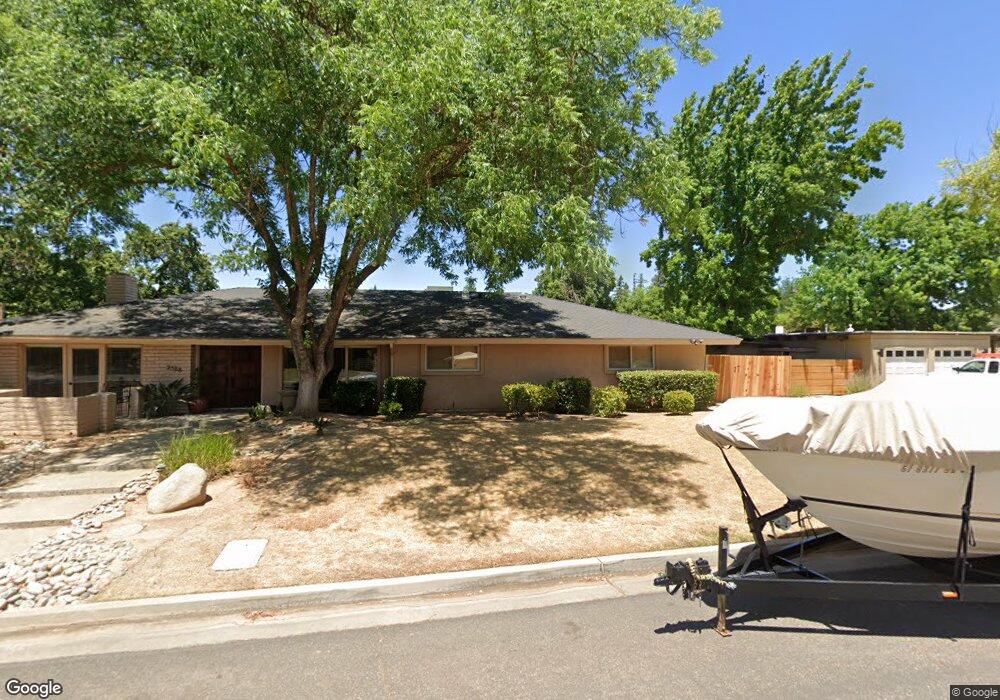
2588 W Scott Ave Fresno, CA 93711
Van Ness Extension NeighborhoodEstimated Value: $665,000 - $805,000
4
Beds
3
Baths
2,832
Sq Ft
$255/Sq Ft
Est. Value
About This Home
This home is located at 2588 W Scott Ave, Fresno, CA 93711 and is currently estimated at $721,254, approximately $254 per square foot. 2588 W Scott Ave is a home located in Fresno County with nearby schools including Malloch Elementary School, Tenaya Middle School, and Bullard High School.
Ownership History
Date
Name
Owned For
Owner Type
Purchase Details
Closed on
Apr 10, 1996
Sold by
The Money Store California Inc
Bought by
Troehler Michael J and Troehler Elise R
Current Estimated Value
Home Financials for this Owner
Home Financials are based on the most recent Mortgage that was taken out on this home.
Original Mortgage
$170,000
Outstanding Balance
$8,255
Interest Rate
7.68%
Mortgage Type
Seller Take Back
Estimated Equity
$712,999
Purchase Details
Closed on
Jun 20, 1995
Sold by
Hampton Wade P and Hampton Betty
Bought by
The Money Store California Inc
Create a Home Valuation Report for This Property
The Home Valuation Report is an in-depth analysis detailing your home's value as well as a comparison with similar homes in the area
Home Values in the Area
Average Home Value in this Area
Purchase History
| Date | Buyer | Sale Price | Title Company |
|---|---|---|---|
| Troehler Michael J | $170,000 | Chicago Title Co | |
| The Money Store California Inc | $144,917 | North American Title |
Source: Public Records
Mortgage History
| Date | Status | Borrower | Loan Amount |
|---|---|---|---|
| Open | Troehler Michael J | $170,000 |
Source: Public Records
Tax History Compared to Growth
Tax History
| Year | Tax Paid | Tax Assessment Tax Assessment Total Assessment is a certain percentage of the fair market value that is determined by local assessors to be the total taxable value of land and additions on the property. | Land | Improvement |
|---|---|---|---|---|
| 2025 | $3,443 | $282,385 | $91,352 | $191,033 |
| 2023 | $3,378 | $271,421 | $87,805 | $183,616 |
| 2022 | $3,332 | $266,100 | $86,084 | $180,016 |
| 2021 | $3,240 | $260,884 | $84,397 | $176,487 |
| 2020 | $3,227 | $258,210 | $83,532 | $174,678 |
| 2019 | $3,101 | $253,148 | $81,895 | $171,253 |
| 2018 | $3,033 | $248,186 | $80,290 | $167,896 |
| 2017 | $2,981 | $243,320 | $78,716 | $164,604 |
| 2016 | $2,882 | $238,550 | $77,173 | $161,377 |
| 2015 | $2,838 | $234,967 | $76,014 | $158,953 |
| 2014 | $2,783 | $230,365 | $74,525 | $155,840 |
Source: Public Records
Map
Nearby Homes
- 2553 W Scott Ave
- 5039 N Van Ness Blvd
- 5284 N Pleasant Ave
- 4960 N Holt Ave Unit 101
- 4974 N Holt Ave Unit 102
- 4936 N Holt Ave Unit 101
- 4924 N Holt Ave Unit 103
- 2739 W San Ramon Ave
- 2740 W San Madele Ave
- 5287 N Sequoia Dr
- 2013 W Fairmont Ave
- 4880 N Hulbert Ave Unit 101
- 4856 N Hulbert Ave Unit 101
- 3078 W Barstow Ave
- 2190 W Via Cipressi
- 2457 W San Gabriel Ave
- 4848 N Hulbert Ave Unit 102
- 5375 N Forkner Ave
- 4707 N Kavanagh Ave
- 4908 N Sequoia Ave Unit 102
- 2572 W Scott Ave
- 2587 W San Jose Ave
- 5139 N Pleasant Ave
- 2575 W San Jose Ave
- 2589 W Scott Ave
- 2554 W Scott Ave
- 5167 N Pleasant Ave
- 2571 W Scott Ave
- 2555 W San Jose Ave
- 2611 W Scott Ave
- 2618 W Scott Ave
- 2633 W San Jose Ave
- 2540 W Scott Ave
- 5094 N Pleasant Ave
- 2586 W San Jose Ave
- 5101 N Pleasant Ave
- 2541 W San Jose Ave
- 2570 W San Jose Ave
- 2626 W Scott Ave
- 2618 W San Jose Ave