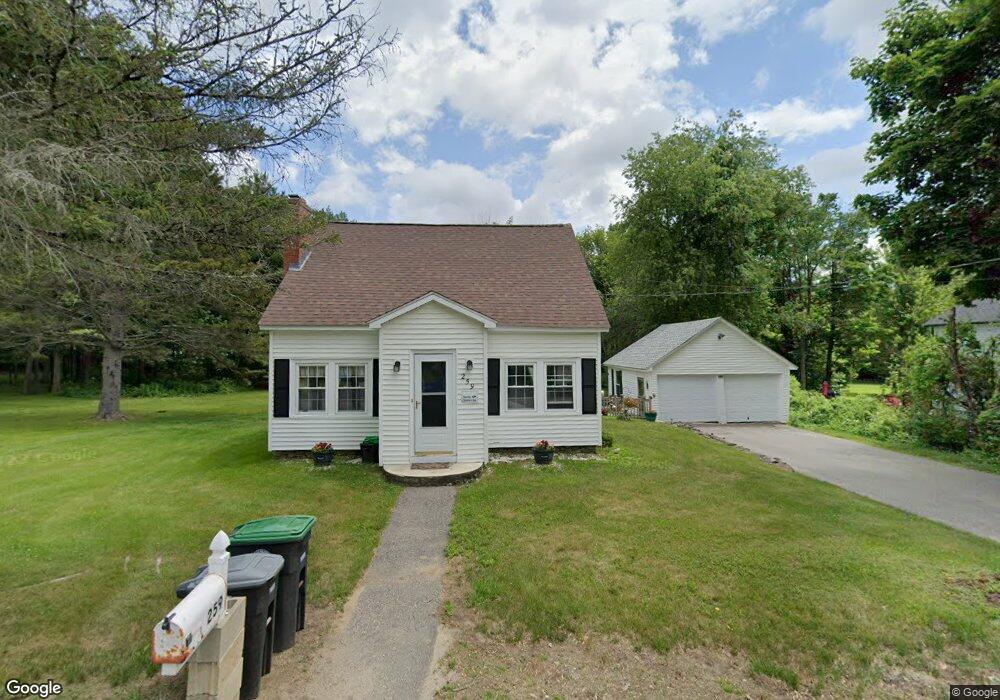
259 Kendall St Franklin, NH 03235
Estimated Value: $317,000 - $446,000
3
Beds
1
Bath
1,209
Sq Ft
$296/Sq Ft
Est. Value
About This Home
This home is located at 259 Kendall St, Franklin, NH 03235 and is currently estimated at $357,562, approximately $295 per square foot. 259 Kendall St is a home located in Merrimack County with nearby schools including Paul A. Smith School, Franklin Middle School, and Franklin High School.
Ownership History
Date
Name
Owned For
Owner Type
Purchase Details
Closed on
Dec 2, 2010
Sold by
Household Finance
Bought by
Greenhalgh Christne M
Current Estimated Value
Home Financials for this Owner
Home Financials are based on the most recent Mortgage that was taken out on this home.
Original Mortgage
$88,987
Outstanding Balance
$58,792
Interest Rate
4.22%
Mortgage Type
Purchase Money Mortgage
Estimated Equity
$298,770
Purchase Details
Closed on
Nov 13, 2001
Sold by
Rankins Linda J
Bought by
Powers Lynda R
Home Financials for this Owner
Home Financials are based on the most recent Mortgage that was taken out on this home.
Original Mortgage
$75,000
Interest Rate
6.77%
Purchase Details
Closed on
Nov 23, 1998
Sold by
Rankins Leo H and Rankins Elizabeth J
Bought by
Rankins Linda J
Home Financials for this Owner
Home Financials are based on the most recent Mortgage that was taken out on this home.
Original Mortgage
$47,000
Interest Rate
6.49%
Create a Home Valuation Report for This Property
The Home Valuation Report is an in-depth analysis detailing your home's value as well as a comparison with similar homes in the area
Home Values in the Area
Average Home Value in this Area
Purchase History
| Date | Buyer | Sale Price | Title Company |
|---|---|---|---|
| Greenhalgh Christne M | $97,000 | -- | |
| Powers Lynda R | $110,000 | -- | |
| Rankins Linda J | $74,000 | -- |
Source: Public Records
Mortgage History
| Date | Status | Borrower | Loan Amount |
|---|---|---|---|
| Open | Rankins Linda J | $88,987 | |
| Previous Owner | Rankins Linda J | $75,000 | |
| Previous Owner | Rankins Linda J | $47,000 |
Source: Public Records
Tax History Compared to Growth
Tax History
| Year | Tax Paid | Tax Assessment Tax Assessment Total Assessment is a certain percentage of the fair market value that is determined by local assessors to be the total taxable value of land and additions on the property. | Land | Improvement |
|---|---|---|---|---|
| 2024 | $4,521 | $263,600 | $77,900 | $185,700 |
| 2023 | $4,286 | $263,600 | $77,900 | $185,700 |
| 2022 | $3,880 | $159,100 | $64,100 | $95,000 |
| 2021 | $3,693 | $159,100 | $64,100 | $95,000 |
| 2020 | $3,634 | $159,100 | $64,100 | $95,000 |
| 2019 | $3,570 | $158,900 | $64,100 | $94,800 |
| 2018 | $3,489 | $158,900 | $64,100 | $94,800 |
| 2017 | $3,456 | $135,200 | $40,100 | $95,100 |
| 2016 | $3,411 | $135,200 | $40,100 | $95,100 |
| 2015 | $2,361 | $94,640 | $28,070 | $66,570 |
| 2011 | $3,245 | $150,800 | $46,500 | $104,300 |
Source: Public Records
Map
Nearby Homes
- 42 Woodrow Ave
- 225 Kendall St
- 9 Hunt Ave
- 193 Kendall St
- 208 Sanborn St
- Lot 4 Piper St
- 180 Kendall St
- 21 Mountain View Dr
- 28 Maple Square
- 624 Central St
- 0 Rowell Dr Unit 406 5043422
- 46 Sanborn St
- 721 Central St
- 24 Munroe St Unit 2
- 24 Munroe St Unit 1&2
- 24 Munroe St Unit 1
- 319 Victory Dr
- 416 Central St
- 99 Pleasant St
- 12 Foothills Way