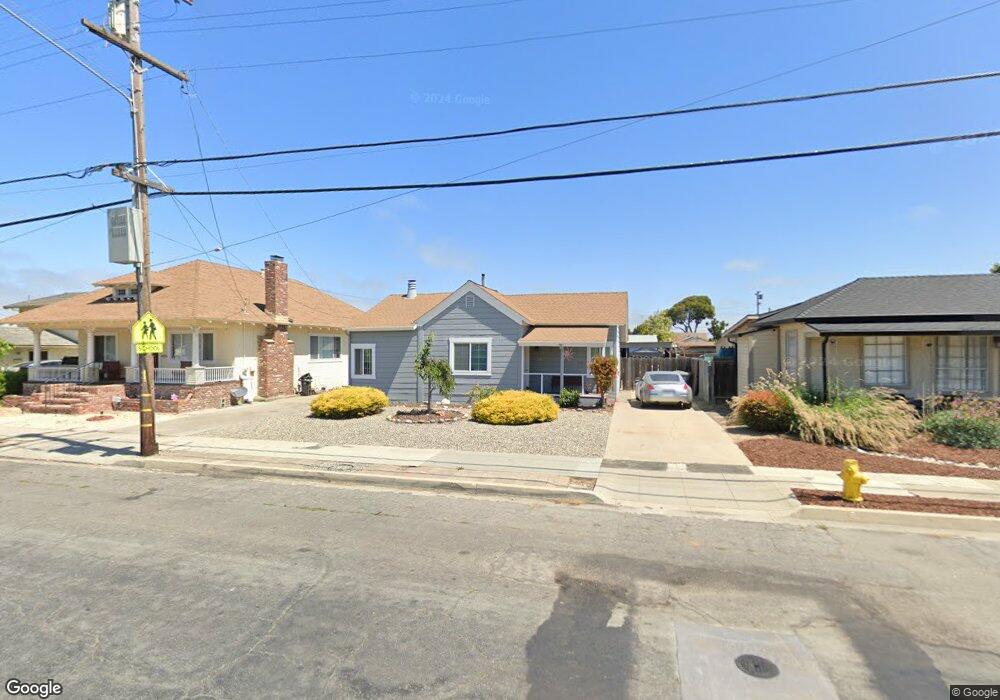
259 Maple St Salinas, CA 93901
South Salinas NeighborhoodEstimated Value: $578,000 - $673,000
3
Beds
1
Bath
886
Sq Ft
$688/Sq Ft
Est. Value
About This Home
This home is located at 259 Maple St, Salinas, CA 93901 and is currently estimated at $609,724, approximately $688 per square foot. 259 Maple St is a home located in Monterey County with nearby schools including Lincoln Elementary School, Monterey Park Elementary School, and Mission Park Elementary School.
Ownership History
Date
Name
Owned For
Owner Type
Purchase Details
Closed on
Jan 26, 2010
Sold by
Cronn Patricia and Mc Allister John
Bought by
Cronn James M and Cronn Patricia
Current Estimated Value
Purchase Details
Closed on
Oct 5, 2007
Sold by
Cronn James
Bought by
Cronn Patricia
Purchase Details
Closed on
Dec 7, 2005
Sold by
Cronn Patricia and Mcallister John
Bought by
Tack Larry D and Tack Debra J
Home Financials for this Owner
Home Financials are based on the most recent Mortgage that was taken out on this home.
Original Mortgage
$387,000
Interest Rate
6.35%
Mortgage Type
Purchase Money Mortgage
Purchase Details
Closed on
Mar 7, 2002
Sold by
Mcallister Ann Marie
Bought by
Cronn Patricia A and Mcallister John
Create a Home Valuation Report for This Property
The Home Valuation Report is an in-depth analysis detailing your home's value as well as a comparison with similar homes in the area
Home Values in the Area
Average Home Value in this Area
Purchase History
| Date | Buyer | Sale Price | Title Company |
|---|---|---|---|
| Cronn James M | $70,000 | None Available | |
| Cronn Patricia | -- | Chicago Title Company | |
| Choate Barbara | -- | Chicago Title Company | |
| Cronn Patricia | -- | Chicago Title Company | |
| Tack Larry D | $430,000 | Old Republic Title | |
| Cronn Patricia A | -- | -- |
Source: Public Records
Mortgage History
| Date | Status | Borrower | Loan Amount |
|---|---|---|---|
| Previous Owner | Tack Larry D | $387,000 |
Source: Public Records
Tax History
| Year | Tax Paid | Tax Assessment Tax Assessment Total Assessment is a certain percentage of the fair market value that is determined by local assessors to be the total taxable value of land and additions on the property. | Land | Improvement |
|---|---|---|---|---|
| 2025 | $2,780 | $240,453 | $186,295 | $54,158 |
| 2024 | $2,780 | $235,740 | $182,643 | $53,097 |
| 2023 | $2,686 | $231,118 | $179,062 | $52,056 |
| 2022 | $2,585 | $226,587 | $175,551 | $51,036 |
| 2021 | $2,484 | $222,145 | $172,109 | $50,036 |
| 2020 | $2,415 | $219,868 | $170,345 | $49,523 |
| 2019 | $2,397 | $215,557 | $167,005 | $48,552 |
| 2018 | $2,366 | $211,331 | $163,731 | $47,600 |
| 2017 | $2,368 | $207,188 | $160,521 | $46,667 |
| 2016 | $2,369 | $203,126 | $157,374 | $45,752 |
| 2015 | $2,390 | $200,076 | $155,011 | $45,065 |
| 2014 | $2,231 | $196,158 | $151,975 | $44,183 |
Source: Public Records
Map
Nearby Homes
- 1 Santa Lucia Ave
- 123 Chestnut St
- 202 Pine St
- 321 Hawthorne St
- 813 Pajaro St
- 333 Hawthorne St
- 116 Oak St
- 22 Willow St
- 612 Alameda Ave
- 54 Katherine Ave
- 50 Katherine Ave
- 14 San Juan Dr
- 220 Pajaro St
- 323 San Miguel Ave
- 646 Santa Cruz Ave
- 1115 San Angelo Dr
- 1211 Via Paraiso
- 234 Cherry Dr
- 1055 Padre Dr Unit 2
- 1051 Padre Dr Unit 7
Your Personal Tour Guide
Ask me questions while you tour the home.