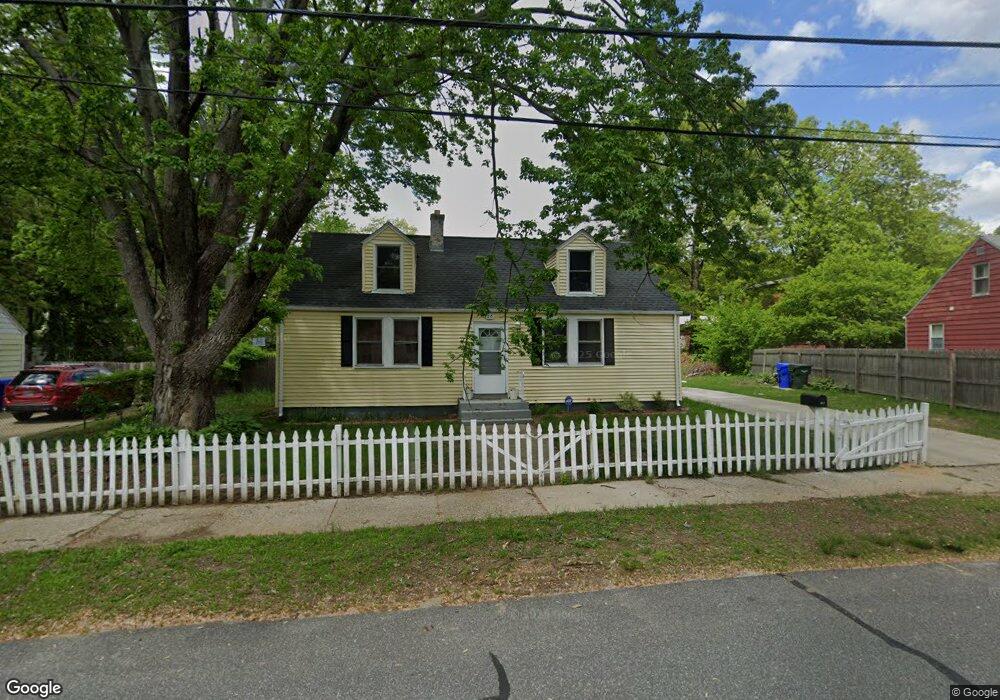
26 Amore Rd Springfield, MA 01109
Bay NeighborhoodEstimated Value: $230,000 - $264,000
3
Beds
1
Bath
1,330
Sq Ft
$186/Sq Ft
Est. Value
About This Home
This home is located at 26 Amore Rd, Springfield, MA 01109 and is currently estimated at $247,916, approximately $186 per square foot. 26 Amore Rd is a home located in Hampden County with nearby schools including Homer Street Elementary School, John F. Kennedy Academy, and Roger L. Putnam Vocational Technical Academy.
Ownership History
Date
Name
Owned For
Owner Type
Purchase Details
Closed on
Aug 31, 2011
Sold by
Messier Timothy J
Bought by
Delgado Ramon
Current Estimated Value
Home Financials for this Owner
Home Financials are based on the most recent Mortgage that was taken out on this home.
Original Mortgage
$90,250
Outstanding Balance
$62,565
Interest Rate
4.52%
Mortgage Type
Purchase Money Mortgage
Estimated Equity
$185,351
Purchase Details
Closed on
Dec 3, 2010
Sold by
Brown Terra L and Brown Carol D
Bought by
Messier Timothy J
Purchase Details
Closed on
Jan 31, 2007
Sold by
Brown Carol D and Brown William W
Bought by
Brown Carol D and Brown Terra L
Home Financials for this Owner
Home Financials are based on the most recent Mortgage that was taken out on this home.
Original Mortgage
$50,000
Interest Rate
6.16%
Mortgage Type
Purchase Money Mortgage
Create a Home Valuation Report for This Property
The Home Valuation Report is an in-depth analysis detailing your home's value as well as a comparison with similar homes in the area
Home Values in the Area
Average Home Value in this Area
Purchase History
| Date | Buyer | Sale Price | Title Company |
|---|---|---|---|
| Delgado Ramon | $95,000 | -- | |
| Messier Timothy J | $55,000 | -- | |
| Brown Carol D | -- | -- |
Source: Public Records
Mortgage History
| Date | Status | Borrower | Loan Amount |
|---|---|---|---|
| Open | Delgado Ramon | $90,250 | |
| Previous Owner | Brown Carol D | $50,000 |
Source: Public Records
Tax History
| Year | Tax Paid | Tax Assessment Tax Assessment Total Assessment is a certain percentage of the fair market value that is determined by local assessors to be the total taxable value of land and additions on the property. | Land | Improvement |
|---|---|---|---|---|
| 2025 | $2,940 | $187,500 | $42,100 | $145,400 |
| 2024 | $3,039 | $189,200 | $35,100 | $154,100 |
| 2023 | $2,627 | $154,100 | $31,900 | $122,200 |
| 2022 | $2,616 | $139,000 | $29,800 | $109,200 |
| 2021 | $2,381 | $126,000 | $27,100 | $98,900 |
| 2020 | $2,232 | $114,300 | $27,100 | $87,200 |
| 2019 | $2,165 | $110,000 | $27,100 | $82,900 |
| 2018 | $4,445 | $106,900 | $27,100 | $79,800 |
| 2017 | $1,724 | $87,700 | $25,100 | $62,600 |
| 2016 | $1,752 | $89,100 | $25,100 | $64,000 |
| 2015 | $1,674 | $85,100 | $25,100 | $60,000 |
Source: Public Records
Map
Nearby Homes
- 52-54 Aster St
- 47 Arbutus St
- 99 Edgemont St
- 75-77 Sycamore St
- 17 Bushwick Place
- 46 Balis St
- 15 Kenyon St
- 158-160 Oak Grove Ave
- 16 Cambridge St
- 21 Clifford St
- 145 Cambridge St
- 65 Montrose St
- 148 Yale St
- 48-50 Dresden St
- 106 Amherst St
- 17 Stuyvesant St
- 163 Marion St
- 28 Porter St
- 96 Elijah St
- 283 Wilbraham Rd
Your Personal Tour Guide
Ask me questions while you tour the home.