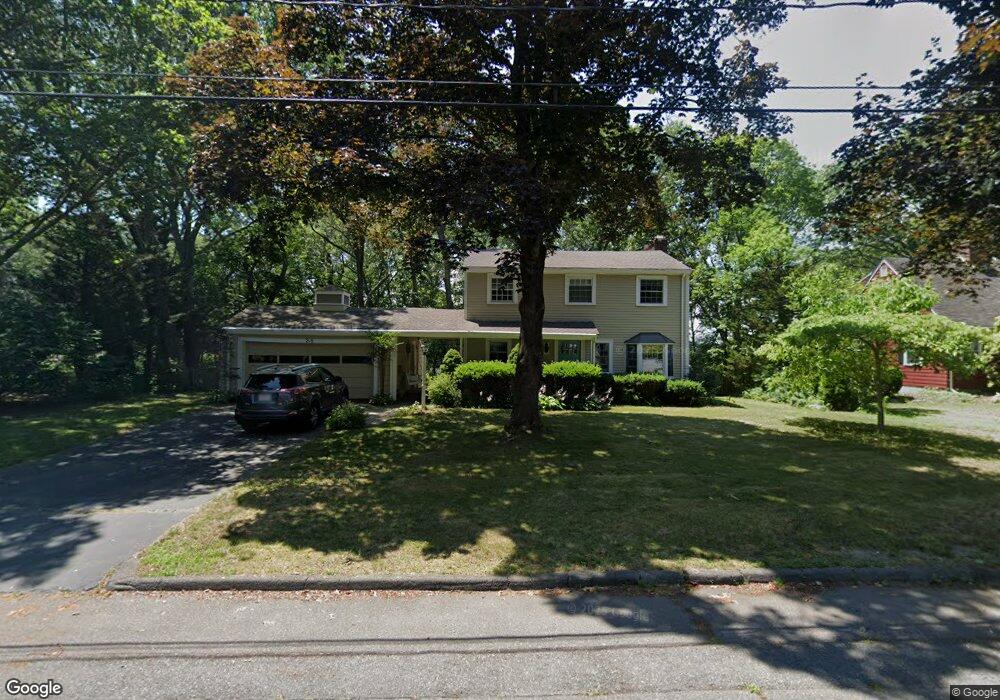
26 Arthur Ave Marblehead, MA 01945
Estimated Value: $1,016,685 - $1,138,000
4
Beds
2
Baths
1,888
Sq Ft
$575/Sq Ft
Est. Value
About This Home
This home is located at 26 Arthur Ave, Marblehead, MA 01945 and is currently estimated at $1,085,921, approximately $575 per square foot. 26 Arthur Ave is a home located in Essex County with nearby schools including Marblehead High School, Tower School, and Devereux School.
Ownership History
Date
Name
Owned For
Owner Type
Purchase Details
Closed on
Jul 12, 2016
Sold by
Lloyd Matthew M and Wilson-Lloyd Melanie B
Bought by
Wilson-Lloyd Melanie B
Current Estimated Value
Home Financials for this Owner
Home Financials are based on the most recent Mortgage that was taken out on this home.
Original Mortgage
$466,400
Outstanding Balance
$372,047
Interest Rate
3.64%
Mortgage Type
New Conventional
Estimated Equity
$713,874
Purchase Details
Closed on
Apr 19, 2005
Sold by
Est Thorner Barbara H and Thorner Gordon H
Bought by
Lloyd Matthew M and Lloyd Melanie W
Home Financials for this Owner
Home Financials are based on the most recent Mortgage that was taken out on this home.
Original Mortgage
$440,000
Interest Rate
5.78%
Mortgage Type
Purchase Money Mortgage
Create a Home Valuation Report for This Property
The Home Valuation Report is an in-depth analysis detailing your home's value as well as a comparison with similar homes in the area
Home Values in the Area
Average Home Value in this Area
Purchase History
| Date | Buyer | Sale Price | Title Company |
|---|---|---|---|
| Wilson-Lloyd Melanie B | -- | -- | |
| Wilson-Lloyd Melanie B | -- | -- | |
| Lloyd Matthew M | $600,000 | -- | |
| Lloyd Matthew M | $600,000 | -- |
Source: Public Records
Mortgage History
| Date | Status | Borrower | Loan Amount |
|---|---|---|---|
| Open | Wilson-Lloyd Melanie B | $466,400 | |
| Closed | Wilson-Lloyd Melanie B | $466,400 | |
| Previous Owner | Lloyd Matthew M | $394,000 | |
| Previous Owner | Lloyd Matthew M | $440,000 | |
| Previous Owner | Lloyd Matthew M | $60,000 |
Source: Public Records
Tax History
| Year | Tax Paid | Tax Assessment Tax Assessment Total Assessment is a certain percentage of the fair market value that is determined by local assessors to be the total taxable value of land and additions on the property. | Land | Improvement |
|---|---|---|---|---|
| 2025 | $8,429 | $931,400 | $658,800 | $272,600 |
| 2024 | $8,562 | $955,600 | $691,700 | $263,900 |
| 2023 | $9,845 | $984,500 | $774,100 | $210,400 |
| 2022 | $8,579 | $815,500 | $609,400 | $206,100 |
| 2021 | $8,124 | $779,700 | $576,500 | $203,200 |
| 2020 | $7,985 | $768,500 | $576,500 | $192,000 |
| 2019 | $7,468 | $695,300 | $510,600 | $184,700 |
| 2018 | $6,868 | $623,200 | $477,600 | $145,600 |
| 2017 | $6,499 | $590,300 | $444,700 | $145,600 |
| 2016 | $6,187 | $557,400 | $411,800 | $145,600 |
| 2015 | $6,176 | $557,400 | $411,800 | $145,600 |
| 2014 | $6,096 | $549,700 | $395,300 | $154,400 |
Source: Public Records
Map
Nearby Homes
- 33 W Shore Dr
- 34 Lafayette St
- 11 Angenica Terrace
- 4 Dean Rd
- 4 Fairview Rd
- 12 Pickwick Rd
- 16 Pickwick Rd
- 282 Pleasant St
- 212 Humphrey St Unit 205
- 106 Broadway Unit 3
- 11 Elbridge Ln Unit 11
- 30 Haley Rd Unit 1
- 1 Shore Ave
- 29 Ocean Ave Unit 4
- 469 Loring Ave
- 2 Halsey Way Unit 40C
- 28 Surrey Rd
- 197A W Shore Dr Unit A
- 3 Stillwell Dr Unit 10B
- 8 Russell Dr Unit 7D
Your Personal Tour Guide
Ask me questions while you tour the home.