26 Burley Ave Unit 22 Nashua, NH 03062
West Hollis NeighborhoodEstimated Value: $696,561 - $868,000
4
Beds
3
Baths
2,176
Sq Ft
$363/Sq Ft
Est. Value
About This Home
This home is located at 26 Burley Ave Unit 22, Nashua, NH 03062 and is currently estimated at $790,390, approximately $363 per square foot. 26 Burley Ave Unit 22 is a home located in Hillsborough County with nearby schools including Main Dunstable School, Elm Street Middle School, and Nashua High School South.
Ownership History
Date
Name
Owned For
Owner Type
Purchase Details
Closed on
Jul 28, 2010
Sold by
Adoman Homes Llc
Bought by
Abrahamsson John T and Abrahamsson Michelle
Current Estimated Value
Home Financials for this Owner
Home Financials are based on the most recent Mortgage that was taken out on this home.
Original Mortgage
$320,573
Outstanding Balance
$213,663
Interest Rate
4.78%
Mortgage Type
Purchase Money Mortgage
Estimated Equity
$576,727
Create a Home Valuation Report for This Property
The Home Valuation Report is an in-depth analysis detailing your home's value as well as a comparison with similar homes in the area
Home Values in the Area
Average Home Value in this Area
Purchase History
| Date | Buyer | Sale Price | Title Company |
|---|---|---|---|
| Abrahamsson John T | $324,900 | -- |
Source: Public Records
Mortgage History
| Date | Status | Borrower | Loan Amount |
|---|---|---|---|
| Open | Abrahamsson John T | $320,573 |
Source: Public Records
Tax History Compared to Growth
Tax History
| Year | Tax Paid | Tax Assessment Tax Assessment Total Assessment is a certain percentage of the fair market value that is determined by local assessors to be the total taxable value of land and additions on the property. | Land | Improvement |
|---|---|---|---|---|
| 2024 | $9,960 | $626,400 | $93,000 | $533,400 |
| 2023 | $9,642 | $528,900 | $93,000 | $435,900 |
| 2022 | $9,557 | $528,900 | $93,000 | $435,900 |
| 2021 | $8,786 | $378,400 | $93,100 | $285,300 |
| 2020 | $8,556 | $378,400 | $93,100 | $285,300 |
| 2019 | $8,234 | $378,400 | $93,100 | $285,300 |
| 2018 | $8,026 | $378,400 | $93,100 | $285,300 |
| 2017 | $8,632 | $334,700 | $80,900 | $253,800 |
| 2016 | $8,391 | $334,700 | $80,900 | $253,800 |
| 2015 | $8,210 | $334,700 | $80,900 | $253,800 |
| 2014 | $8,050 | $334,700 | $80,900 | $253,800 |
Source: Public Records
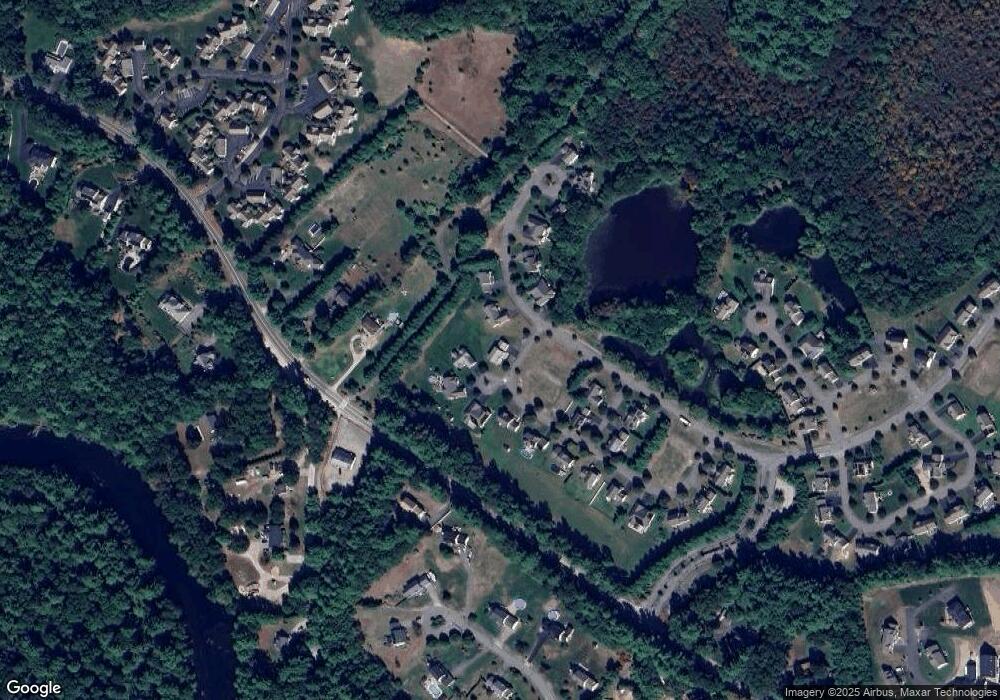
Map
Nearby Homes
- 26 Burley Ave Unit 17
- 20 Serotta Ave Unit 18
- 24 Burley Ave Unit 16
- 22 Burley Ave Unit 15
- 20 Burley Ave Unit 14
- 22 Serotta Ave Unit 19
- 18 Burley Ave Unit 13
- 19 Serotta Ave Unit 25
- 21 Serotta Ave Unit 24
- 16 Burley Ave Unit 12
- 3 Bianchi Ct Unit 9
- 5 Bianchi Ct Unit 10
- 29 Groton Rd
- 14 Burley Ave Unit 11
- 29 W Groton Rd
- 4 Bianchi Ct Unit 7
- 4 Bianchi Ct Unit 7
- 23 Serotta Ave Unit 23
- 20 W Groton Rd
- 25 Groton Rd