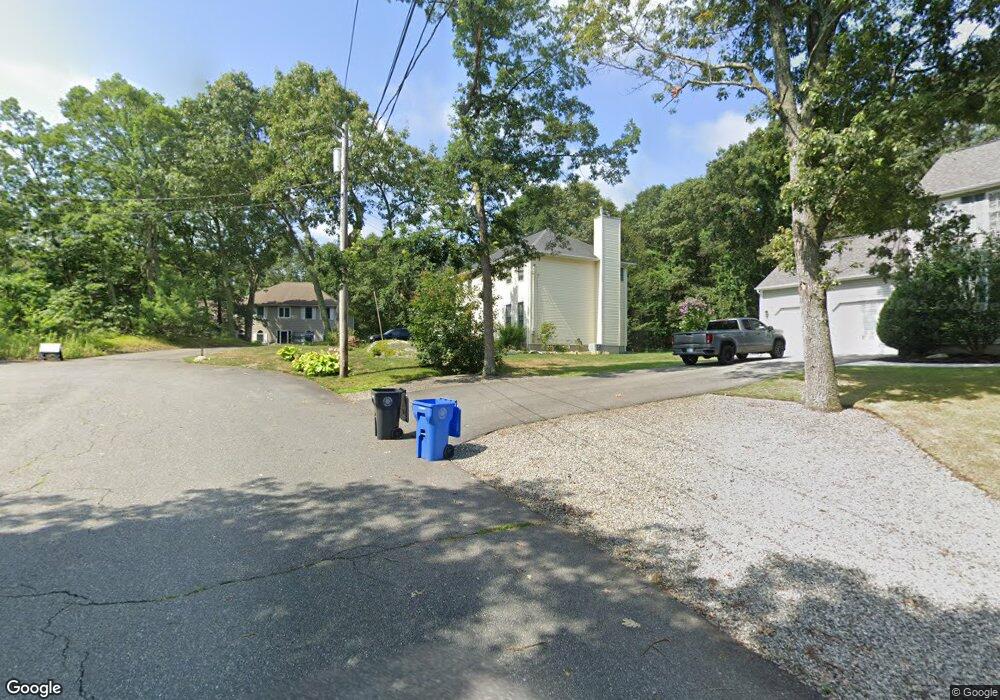
26 Canton Ct Cranston, RI 02921
Oaklawn NeighborhoodEstimated Value: $649,957 - $695,000
3
Beds
3
Baths
2,000
Sq Ft
$339/Sq Ft
Est. Value
About This Home
This home is located at 26 Canton Ct, Cranston, RI 02921 and is currently estimated at $678,489, approximately $339 per square foot. 26 Canton Ct is a home located in Providence County with nearby schools including Oak Lawn School, Western Hills Middle School, and Cranston High School West.
Ownership History
Date
Name
Owned For
Owner Type
Purchase Details
Closed on
May 15, 2003
Sold by
Lachance Marie
Bought by
Carroccio Angelo and Carroccio Any
Current Estimated Value
Home Financials for this Owner
Home Financials are based on the most recent Mortgage that was taken out on this home.
Original Mortgage
$209,000
Interest Rate
5.84%
Purchase Details
Closed on
Oct 4, 2000
Sold by
Natick Hill Est Llc
Bought by
Lachance Marie C
Home Financials for this Owner
Home Financials are based on the most recent Mortgage that was taken out on this home.
Original Mortgage
$274,410
Interest Rate
7.96%
Create a Home Valuation Report for This Property
The Home Valuation Report is an in-depth analysis detailing your home's value as well as a comparison with similar homes in the area
Home Values in the Area
Average Home Value in this Area
Purchase History
| Date | Buyer | Sale Price | Title Company |
|---|---|---|---|
| Carroccio Angelo | $309,000 | -- | |
| Lachance Marie C | $305,000 | -- |
Source: Public Records
Mortgage History
| Date | Status | Borrower | Loan Amount |
|---|---|---|---|
| Open | Lachance Marie C | $193,000 | |
| Closed | Lachance Marie C | $209,000 | |
| Previous Owner | Lachance Marie C | $274,410 |
Source: Public Records
Tax History
| Year | Tax Paid | Tax Assessment Tax Assessment Total Assessment is a certain percentage of the fair market value that is determined by local assessors to be the total taxable value of land and additions on the property. | Land | Improvement |
|---|---|---|---|---|
| 2025 | $7,492 | $539,800 | $169,300 | $370,500 |
| 2024 | $7,347 | $539,800 | $169,300 | $370,500 |
| 2023 | $7,297 | $386,100 | $123,400 | $262,700 |
| 2022 | $7,147 | $386,100 | $123,400 | $262,700 |
| 2021 | $6,950 | $386,100 | $123,400 | $262,700 |
| 2020 | $6,954 | $334,800 | $123,400 | $211,400 |
| 2019 | $6,954 | $334,800 | $123,400 | $211,400 |
| 2018 | $6,793 | $334,800 | $123,400 | $211,400 |
| 2017 | $6,905 | $301,000 | $105,800 | $195,200 |
| 2016 | $6,757 | $301,000 | $105,800 | $195,200 |
| 2015 | $6,757 | $301,000 | $105,800 | $195,200 |
| 2014 | $6,322 | $276,800 | $101,300 | $175,500 |
Source: Public Records
Map
Nearby Homes
- 52 Cottonwood Dr
- 78 Wilbur Ave
- 1100 Phenix Ave
- 87 Lincoln Park Ave
- 14 Amanda St
- 1213 Phenix Ave
- 38 Angela Ave
- 20 Manilla Ave
- 50 Briarwood Rd
- 82 Mountain Laurel Dr
- 61 High View Dr
- 8 Ashton Ct
- 1715 Phenix Ave
- 74 Cardinal Rd
- 64 Cardinal Rd
- 20 Hilltop Dr
- 33 Rose Hill Dr
- 157 Sweetbriar Dr
- 1027 Providence St Unit 4B
- 217 Belvedere Dr
Your Personal Tour Guide
Ask me questions while you tour the home.