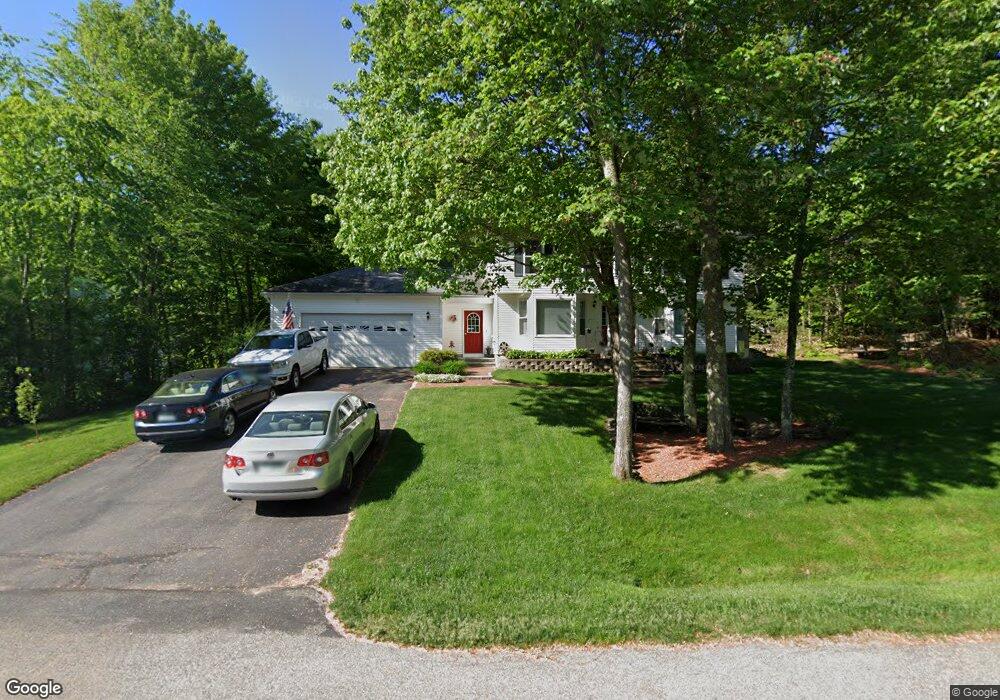
26 Capitol Cir Rochester, NH 03867
Estimated Value: $506,000 - $563,000
4
Beds
2
Baths
1,968
Sq Ft
$276/Sq Ft
Est. Value
About This Home
This home is located at 26 Capitol Cir, Rochester, NH 03867 and is currently estimated at $543,001, approximately $275 per square foot. 26 Capitol Cir is a home located in Strafford County with nearby schools including Mcclelland School, Rochester Middle School, and Spaulding High School.
Ownership History
Date
Name
Owned For
Owner Type
Purchase Details
Closed on
Aug 13, 2019
Sold by
Tardiff Bruce D and Tardiff Margaret M
Bought by
Tardiff Ft
Current Estimated Value
Purchase Details
Closed on
Feb 1, 1999
Sold by
Stlawrence John J and St Lawrence Donna M
Bought by
Tardiff Bruce D and Tardiff Margaret M
Home Financials for this Owner
Home Financials are based on the most recent Mortgage that was taken out on this home.
Original Mortgage
$95,000
Interest Rate
6.67%
Create a Home Valuation Report for This Property
The Home Valuation Report is an in-depth analysis detailing your home's value as well as a comparison with similar homes in the area
Home Values in the Area
Average Home Value in this Area
Purchase History
| Date | Buyer | Sale Price | Title Company |
|---|---|---|---|
| Tardiff Ft | -- | -- | |
| Tardiff Bruce D | $129,900 | -- |
Source: Public Records
Mortgage History
| Date | Status | Borrower | Loan Amount |
|---|---|---|---|
| Previous Owner | Tardiff Bruce D | $60,246 | |
| Previous Owner | Tardiff Bruce D | $95,000 |
Source: Public Records
Tax History Compared to Growth
Tax History
| Year | Tax Paid | Tax Assessment Tax Assessment Total Assessment is a certain percentage of the fair market value that is determined by local assessors to be the total taxable value of land and additions on the property. | Land | Improvement |
|---|---|---|---|---|
| 2024 | $7,294 | $491,200 | $119,700 | $371,500 |
| 2023 | $7,269 | $282,400 | $50,900 | $231,500 |
| 2022 | $7,139 | $282,400 | $50,900 | $231,500 |
| 2021 | $6,961 | $282,400 | $50,900 | $231,500 |
| 2020 | $6,950 | $282,400 | $50,900 | $231,500 |
| 2019 | $7,032 | $282,400 | $50,900 | $231,500 |
| 2018 | $6,514 | $243,400 | $50,900 | $192,500 |
| 2017 | $6,409 | $243,400 | $50,900 | $192,500 |
| 2016 | $6,197 | $219,300 | $50,900 | $168,400 |
| 2015 | $6,173 | $219,300 | $50,900 | $168,400 |
| 2014 | $6,024 | $219,300 | $50,900 | $168,400 |
| 2013 | $6,129 | $232,500 | $60,100 | $172,400 |
| 2012 | $5,971 | $232,500 | $60,100 | $172,400 |
Source: Public Records
Map
Nearby Homes
- 14 1/2 Yvonne St
- 67 Ten Rod Rd
- 71 Ten Rod Rd
- 74 Seneca St
- 49 Shiloh Dr
- 16 Nashoba Dr
- 2 Cape Coral Way Unit A
- 2 Cape Coral Way Unit B
- 13 Miami Way Unit B
- 22 Cherokee Way
- 5 Monadnock Dr
- 30 Cherokee Way
- 32 Monadnock Dr
- 8 Perimeter Dr
- 180 Chestnut Hill Rd
- 79 Millers Farm Dr
- 52 Little Falls Bridge Rd
- 2 Hale St
- 157 Wakefield St
- 22 Trade Wind Ln