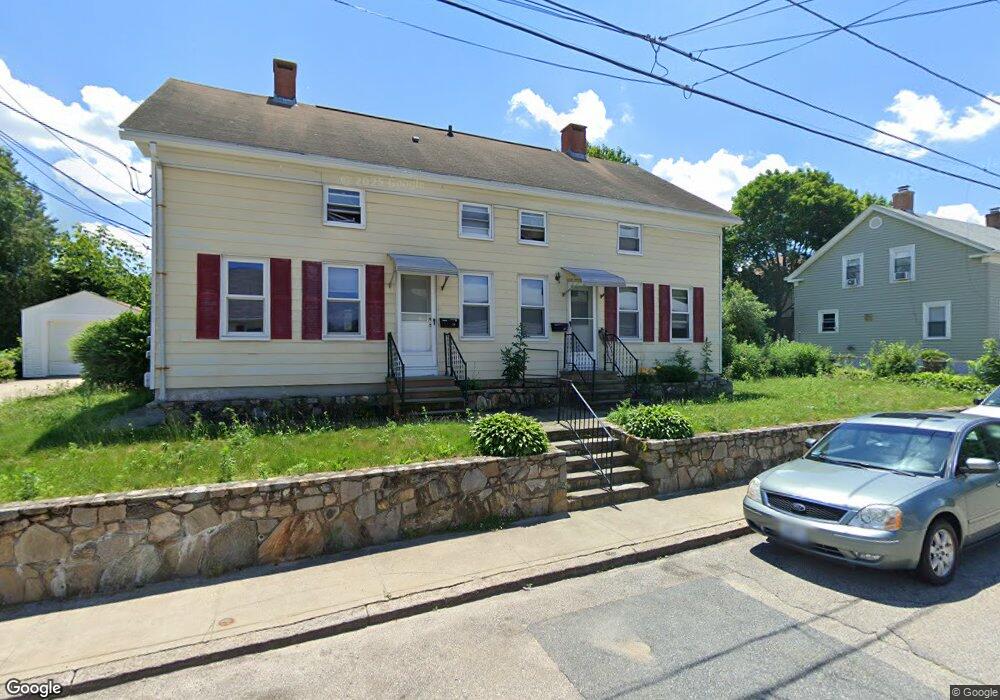
26 Central St West Warwick, RI 02893
West Warwick Centre NeighborhoodEstimated Value: $365,358 - $477,000
4
Beds
3
Baths
2,156
Sq Ft
$190/Sq Ft
Est. Value
About This Home
This home is located at 26 Central St, West Warwick, RI 02893 and is currently estimated at $409,590, approximately $189 per square foot. 26 Central St is a home located in Kent County with nearby schools including West Warwick High School, Islamic School of Rhode Island, and St Joseph School.
Ownership History
Date
Name
Owned For
Owner Type
Purchase Details
Closed on
Feb 25, 2021
Sold by
Anderson Brad E
Bought by
Winemiller Michael and Winemiller Kayla
Current Estimated Value
Home Financials for this Owner
Home Financials are based on the most recent Mortgage that was taken out on this home.
Original Mortgage
$165,000
Outstanding Balance
$147,911
Interest Rate
2.7%
Mortgage Type
Purchase Money Mortgage
Estimated Equity
$261,679
Purchase Details
Closed on
Oct 5, 2009
Sold by
Estevano Dennis
Bought by
Anderson Brad E
Home Financials for this Owner
Home Financials are based on the most recent Mortgage that was taken out on this home.
Original Mortgage
$174,775
Interest Rate
5.12%
Mortgage Type
Purchase Money Mortgage
Create a Home Valuation Report for This Property
The Home Valuation Report is an in-depth analysis detailing your home's value as well as a comparison with similar homes in the area
Home Values in the Area
Average Home Value in this Area
Purchase History
| Date | Buyer | Sale Price | Title Company |
|---|---|---|---|
| Winemiller Michael | $220,000 | None Available | |
| Anderson Brad E | $178,000 | -- |
Source: Public Records
Mortgage History
| Date | Status | Borrower | Loan Amount |
|---|---|---|---|
| Open | Winemiller Michael | $165,000 | |
| Previous Owner | Anderson Brad E | $173,068 | |
| Previous Owner | Anderson Brad E | $174,775 |
Source: Public Records
Tax History Compared to Growth
Tax History
| Year | Tax Paid | Tax Assessment Tax Assessment Total Assessment is a certain percentage of the fair market value that is determined by local assessors to be the total taxable value of land and additions on the property. | Land | Improvement |
|---|---|---|---|---|
| 2025 | $4,943 | $323,300 | $83,800 | $239,500 |
| 2024 | $4,747 | $231,900 | $53,200 | $178,700 |
| 2023 | $4,654 | $231,900 | $53,200 | $178,700 |
| 2022 | $4,580 | $231,900 | $53,200 | $178,700 |
| 2021 | $4,338 | $188,600 | $43,700 | $144,900 |
| 2020 | $4,338 | $188,600 | $43,700 | $144,900 |
| 2019 | $5,530 | $188,600 | $43,700 | $144,900 |
| 2018 | $3,351 | $126,900 | $41,100 | $85,800 |
| 2017 | $3,339 | $126,900 | $41,100 | $85,800 |
| 2016 | $3,279 | $126,900 | $41,100 | $85,800 |
| 2015 | $3,172 | $122,200 | $41,100 | $81,100 |
| 2014 | $3,103 | $122,200 | $41,100 | $81,100 |
Source: Public Records
Map
Nearby Homes
- 30 Central St
- 32 Central St
- 22 Central St
- 86 Providence St
- 29 Central St Unit D
- 29 Central St Unit 4
- 31 Central St
- 33 Central St
- 33 Central St Unit 2
- 33 Central St Unit 33
- 25 Central St
- 82 Providence St
- 90 Providence St
- 35 Central St
- 35 Central St Unit 1
- 21 Central St
- 1 Bridge St
- 5 Bridge St
- 18 Central St
- 13 Bridge St