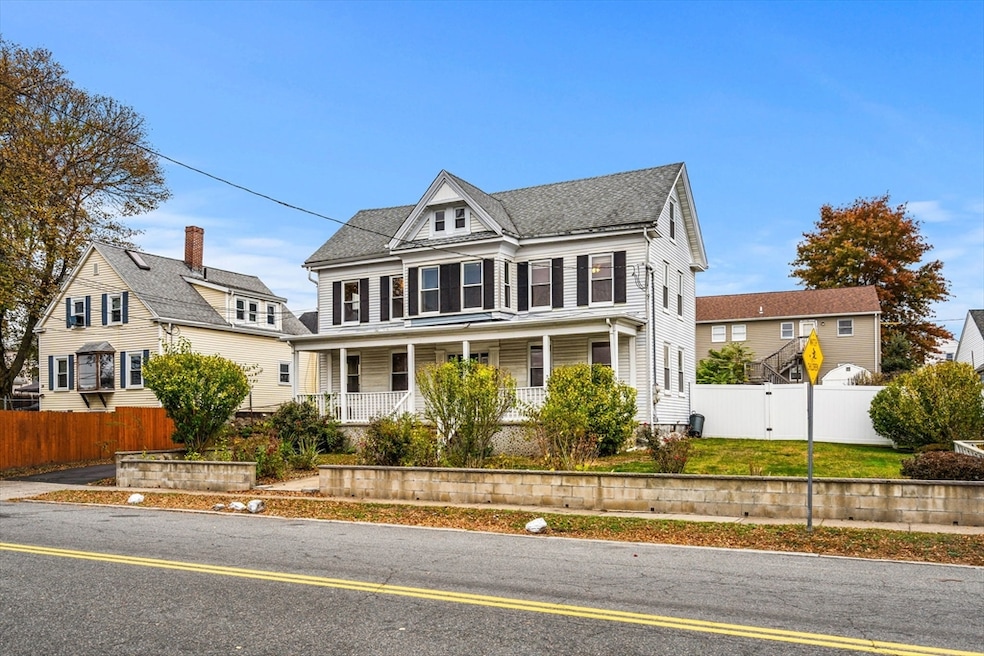
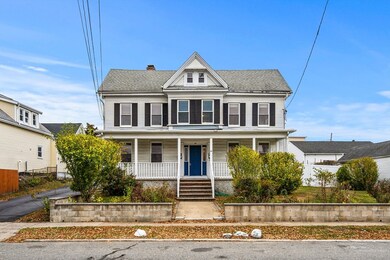
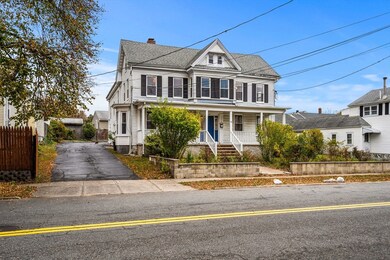
26 Elm St Peabody, MA 01960
Peabody Town Center NeighborhoodEstimated payment $4,776/month
Highlights
- Medical Services
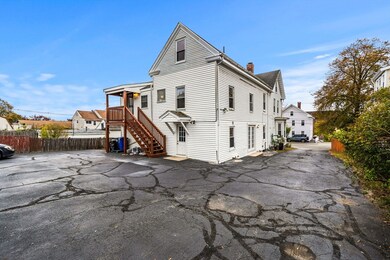
- Deck
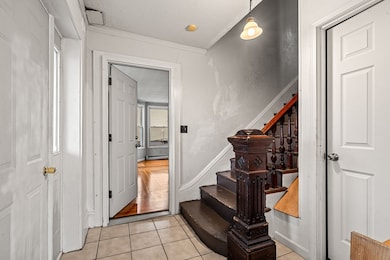
- Wood Flooring
- 0.24 Acre Lot
- Property is near public transit
- Attic
About This Home
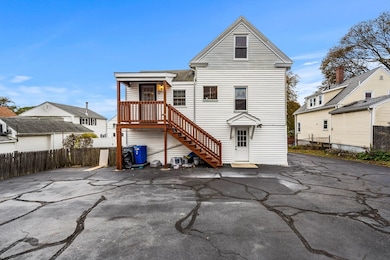
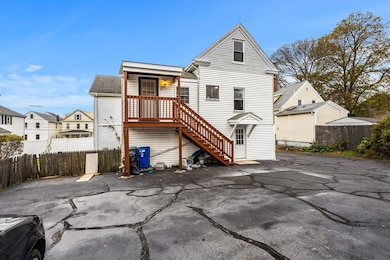
Spacious two-family Colonial offering approximately 3,048 square feet of living space, ideally located close to Peabody's vibrant downtown, schools, and easy access to highways. Each unit features a generous living area, an eat-in kitchen, and ample storage. The upper unit includes three large bedrooms and an office area, while the lower unit offers two spacious bedrooms and an updated composite deck. The property includes a large shared yard, front porch, storage shed and off-street parking for up to five vehicles. Move-in ready with opportunity for cosmetic updates, this home offers excellent potential for both owner-occupants and investors in a desirable neighborhood.
Property Details
Home Type
- Multi-Family
Est. Annual Taxes
- $7,014
Year Built
- Built in 1870
Home Design
- Brick Foundation
- Frame Construction
- Shingle Roof
Interior Spaces
- 3,048 Sq Ft Home
- Property has 1 Level
- 2 Fireplaces
- Sliding Doors
- Living Room
- Dining Room
- Storage
- Storm Windows
- Attic
Kitchen
- Range
- Dishwasher
- Solid Surface Countertops
Flooring
- Wood
- Vinyl
Bedrooms and Bathrooms
- 5 Bedrooms
- 2 Full Bathrooms
- Bathtub with Shower
Laundry
- Dryer
- Washer
Basement
- Basement Fills Entire Space Under The House
- Interior Basement Entry
- Block Basement Construction
Parking
- 5 Car Parking Spaces
- Driveway
- Open Parking
- Off-Street Parking
Outdoor Features
- Bulkhead
- Balcony
- Deck
Utilities
- No Cooling
- Heating System Uses Natural Gas
- Baseboard Heating
- 110 Volts
Additional Features
- 10,530 Sq Ft Lot
- Property is near public transit
Listing and Financial Details
- Assessor Parcel Number 2104754
Community Details
Overview
- 2 Units
Amenities
- Medical Services
- Shops
- Coin Laundry
Recreation
- Park
Map
Home Values in the Area
Average Home Value in this Area
Tax History
| Year | Tax Paid | Tax Assessment Tax Assessment Total Assessment is a certain percentage of the fair market value that is determined by local assessors to be the total taxable value of land and additions on the property. | Land | Improvement |
|---|---|---|---|---|
| 2025 | $7,014 | $757,400 | $224,200 | $533,200 |
| 2024 | $6,860 | $752,200 | $224,200 | $528,000 |
| 2023 | $6,006 | $630,900 | $195,000 | $435,900 |
| 2022 | $5,711 | $565,400 | $174,100 | $391,300 |
| 2021 | $5,468 | $521,300 | $158,300 | $363,000 |
| 2020 | $5,086 | $473,600 | $158,300 | $315,300 |
| 2019 | $4,538 | $412,200 | $158,300 | $253,900 |
| 2018 | $4,251 | $370,900 | $149,300 | $221,600 |
| 2017 | $4,432 | $376,900 | $149,300 | $227,600 |
| 2016 | $4,238 | $355,500 | $149,300 | $206,200 |
| 2015 | $3,731 | $303,300 | $149,700 | $153,600 |
Property History
| Date | Event | Price | List to Sale | Price per Sq Ft |
|---|---|---|---|---|
| 11/05/2025 11/05/25 | Pending | -- | -- | -- |
| 10/30/2025 10/30/25 | For Sale | $799,000 | -- | $262 / Sq Ft |
Purchase History
| Date | Type | Sale Price | Title Company |
|---|---|---|---|
| Deed | $2,000 | -- | |
| Deed | $130,000 | -- |
Mortgage History
| Date | Status | Loan Amount | Loan Type |
|---|---|---|---|
| Open | $122,000 | No Value Available | |
| Open | $285,000 | No Value Available | |
| Previous Owner | $70,000 | No Value Available | |
| Previous Owner | $150,000 | No Value Available |
Source: MLS Property Information Network (MLS PIN)
MLS Number: 73449847
APN: PEAB-000075-000000-000198
Disclaimer: Certain information contained herein is derived from information provided by parties other than Homes.com. All information provided is deemed reliable, but is not guaranteed to be accurate and should be independently verified.
![]() The property listing data and information, or the Images, set forth herein were provided to MLS Property Information Network, Inc. from third party sources, including sellers, lessors and public records, and were compiled by MLS Property Information Network, Inc. The property listing data and information, and the Images, are for the personal, non-commercial use of consumers having a good faith interest in purchasing or leasing listed properties of the type displayed to them and may not be used for any purpose other than to identify prospective properties which such consumers may have a good faith interest in purchasing or leasing. MLS Property Information Network, Inc. and its subscribers disclaim any and all representations and warranties as to the accuracy of the property listing data and information, or as to the accuracy of any of the Images, set forth herein.
The property listing data and information, or the Images, set forth herein were provided to MLS Property Information Network, Inc. from third party sources, including sellers, lessors and public records, and were compiled by MLS Property Information Network, Inc. The property listing data and information, and the Images, are for the personal, non-commercial use of consumers having a good faith interest in purchasing or leasing listed properties of the type displayed to them and may not be used for any purpose other than to identify prospective properties which such consumers may have a good faith interest in purchasing or leasing. MLS Property Information Network, Inc. and its subscribers disclaim any and all representations and warranties as to the accuracy of the property listing data and information, or as to the accuracy of any of the Images, set forth herein.
- 8R Elm St Unit 2
- 4 Northend St
- 4 Elm St Unit 3
- 46 Walnut St
- 8 Walnut St Unit 209
- 25 Northend St
- 8 Crowninshield St Unit 111
- 10 Elliott Place Unit 1R
- 11 A Endicott St Unit 3
- 48 Franklin St
- 8 Newcastle Rd
- 27 Pulaski St
- 130 Lowell St
- 14 Margin St
- 111 Foster St Unit 401
- 111 Foster St Unit 416
- 36 Irving St Unit B
- 2 Osborne St
- 19 Cushing St
- 26 Colonial Rd
